

Four Examples of Designs that Reduce the Site-Specific Health Risks of Climate Change. Example 4: Disease-Carrying Insects.

Disease-Carrying Insects
Health Impact
As annual temperatures warm and precipitation patterns change as a result of climate change, disease-carrying insects have begun to migrate into areas that may not be prepared for them. Dengue is the most common mosquito-borne virus in the world, resulting in 50 to 100 million infections and 25,000 deaths annually. However, the U.S. had largely escaped dengue outbreaks from the end of World War II to 1980. Since that time, sporadic outbreaks have occurred in the Southern U.S., particularly Texas and Florida. The average cost of treatment in the U.S. is $17,803 per patient. (Source: 3rd National Climate Assessment.)
Context
The primary carrier of the virus, the Aedes aegypti mosquito, is extremely sensitive to changes in temperature, precipitation, and the built environment. While models predict the spread of this mosquito north from Mexico and the Carribean into the contiguous United States, studies show that, historically, a combination of building design and social norms have largely protected Americans from infection when outbreaks occur South of the international border. A study of a Dengue outbreak in 1999 found that the level of dengue present in the population of Laredo, Texas, was 1/2 - 1/10 of the population in Nuevo Laredo, Tamaulipas (just across the border in Mexico). The findings were most closely correlated with the presence of closed windows and air conditioning in Texas buildings, effectively blocking exposure to mosquitoes. Furthermore, buildings on the Mexican side of the border not only lacked central air conditioning but their interiors were also often left open to the elements without protective screens over windows and doors.
Design Strategy
As operable windows, passive cooling, and natural ventilation become more common features of green buildings, care must be taken to protect occupants from health threats that could enter from the outside. Otherwise, as has been noted in a number of multi-family developments already, building occupants are not likely to make use of these energy efficiency features – both to avoid the annoyance of stinging insects and to protect themselves from diseases like dengue.
Relevant LEED v4 Credit(s)
Benefits to Climate Change Mitigation and Adaptation
In this example, the homes and businesses in Mexico were more energy efficient than buildings in the U.S., because they did not use air conditioning. This is an example where energy efficiency (i.e., climate change mitigation) should be balanced with safeguards such as screens that protect building occupants from the health hazards associated with climate change (i.e., climate change adaptation).
Go Back to Drought/Flood Example.
Go Back to Main Post.
Copyright: © Biositu, LLC, and Building Public Health, 2015.
Four Examples of Designs that Reduce the Site-Specific Health Risks of Climate Change. Example 3: Drought/Flood Cycle.

Drought/Flood Cycle
Health Impact
The drought/flood cycle has already shifted in many parts of the U.S. due to climate change. Heavy precipitation events are becoming more common each year, concentrating annual rainfall into a smaller period of time each spring, and washing water downstream that historically would have replenished lakes, rivers, and aquifers. Less precipitation falls throughout the remainder of the year, leading to drought conditions. Drowning is the most direct health effect of flooding, resulting in 98 deaths per year in the U.S. It is of particular concern in areas prone to flash flooding and/or tropical storms. Other health impacts associated with drought and flooding include waterborne illness caused by compromised water quality and respiratory illness due to damp indoor environments (flooding) or exposure to wildfires or dust storms (drought). (Source: 3rd National Climate Assessment.)
Context
Central Texas is known as “Flash Flood Alley,” due to the rapidity and severity of flooding that occurs there, particularly following major droughts. In 2008, I co-authored a vulnerability map of Austin, TX, that identifies the neighborhoods with them most acute combination of social vulnerability (e.g., population density, elderly, socially isolated, and minority populations) and environmental vulnerability (e.g., flood plains and low water crossings).
Design Strategy
In subsequent research, I found that evidence in the public health literature supported applying a number of credits in the U.S. Green Building Council’s Leadership in Energy and Environmental Design (LEED) rating system as protective measures in vulnerable neighborhoods. These green building strategies include:
-
promoting the use of alternative forms of transportation to provide multiple evacuation options during flooding events;
-
increasing native vegetation on-site to maximize stormwater retention and filtration; and,
-
making use of rainwater to irrigate, flush toilets, and even provide potable water during and immediately following flooding events.
Relevant LEED v4 Credit(s)
Site assessment
Sensitive land protection
Access to quality transit
Reduced parking footprint
Site development – protect or restore habitat
Open space
Rainwater management
Heat island reduction
Outdoor water use reduction
Indoor water use reduction
Benefits to Climate Change Mitigation
Site shading can reduce a building’s electricity use, one of the major causes of anthropogenic (i.e., human caused) greenhouse gas (GHG) emissions. Alternative forms of transportation reduce the other major source of GHG emissions associated with the built environment – single occupancy car travel.
Benefits to Climate Change Adaptation
Reduce exposure of vulnerable populations to flash flooding. Mitigate exposure through multiple evacuation routes and access to potable water if occupants choose to shelter in place during a flood.
Go Back to Extreme Heat Example. Continue to Disease-Carrying Insects Example.
Go Back to Main Post.
Copyright: © Biositu, LLC, and Building Public Health, 2015.
Four Examples of Designs that Reduce the Site-Specific Health Risks of Climate Change. Example 2: Extreme Heat.

Extreme Heat
Health Impact
The number and intensity of heat waves is increasing in the U.S., resulting in spikes in mortality from heat-related conditions such as heat stroke. Heat waves can also increase the death rate among people with cardiovascular, respiratory, or cerebrovascular disease. (Source: 3rd National Climate Assessment.)
Context
According to the MN Department of Health, in 2001, in spite of an average summer temperature of only 63.8o F, 19 people died in Minnesota of heat-related illness (mostly in the months of July and August). Since that time, as a member of the U.S. CDC’s Climate-Ready States and Cities Initiative grant program, the state has worked on improving prevention and emergency response activities related to extreme heat.
Design Strategy
An HIA facilitated by Biositu, LLC compared the relative vulnerability to heat among three affordable housing designs located in adjacent neighborhoods along the new Central Corridor light rail line between Saint Paul and Minneapolis.
In spite of the projects’ close proximity to each other and similar scope, the recommendations resulting from the HIA varied widely.
-
Recommendations for a mixed-income, mixed-use development in the Hamline-Midway neighborhood: Include a pocket park as part of the development design to mitigate the urban heat island effect. Provide water fountains, misting stations, and interactive water features for children. Install ceiling fans and operable windows with screens to encourage natural ventilation while protecting residents from mosquitoes and other pests. Install an on-site renewable energy installation to provide an uninterruptable power supply in certain common areas in case a heat wave results in a prolonged power outage.
-
Recommendations for a single-family house retrofit in the Frogtown neighborhood: Install landscaping that prioritizes shading the house, deterring mosquitoes, and cultivating edible plants. Focus energy efficiency measures on the roof and attic to reduce solar heat gain during summer months. (Example strategies: light colored or vegetative roof, increased attic insulation, etc.) Install combination storm shutters/screens on doors and windows to encourage use of natural ventilation. Vent the basement to protect for radon contamination and fit it out for use as an in-house cooling center during extreme heat events.
-
Recommendations for a mixed-use, affordable housing development in the Summit-University neighborhood: Install ceiling fans and operable windows with screens to encourage natural ventilation while protecting residents from mosquitoes and other pests. Fit out common areas with air conditioning and designate them as public cooling centers during heat events.
Relevant LEED v4 Credit(s)
Site assessment
Site development - protect or restore habitat
Open space
Heat island reduction
Optimize energy performance
Renewable energy production
Benefits to Climate Change Mitigation
Shading and energy efficiency measures reduce a building’s electricity use, one of the major causes of anthropogenic (i.e., human caused) greenhouse gas emissions.
Benefits to Climate Change Adaptation
Reduce exposure of vulnerable populations (i.e., children and minorities) to extreme heat events. Mitigate exposure through misting stations, water fountains, and cooling centers.
Go Back to Air Pollution Example. Continue to Drought/Flood Example.
Go Back to Main Post.
Photo Credit: Nevit Dilmen
Copyright: © Biositu, LLC, and Building Public Health, 2015.
Four Examples of Designs that Reduce the Site-Specific Health Risks of Climate Change. Example 1: Air Pollution.

Air Pollution
Health Impact
Climate change is projected to increase ground level ozone and/or particulate matter, which can exacerbate respiratory conditions like asthma. (Source: 3rd National Climate Assessment.)
Context
The site selected for the Jack London Gateway Senior Housing project in West Oakland, CA, suffers from poor outdoor air quality due to its proximity to several freeways and the Port of Oakland. Elderly are more vulnerable to the negative health effects of air pollution than the general population. A Health Impact Assessment (HIA) performed by Human Impact Partners recommended identifying sources of air pollution by measuring current levels of particulate matter at several locations on the site and researching the Port’s plans for expansion.
Design Strategy
The entrance of the 55-unit complex was located inside a courtyard oriented away from the freeways and Port and towards the existing neighborhood. Balconies facing the freeway were converted into bay windows. And, air filters were installed in all residential units and common spaces.
Relevant LEED v4 Credit(s)
Site assessment
Minimum indoor air quality performance
Enhanced indoor air quality strategies
Benefits to Climate Change Mitigation
Integrating the complex into the existing neighborhood encourages alternative forms of transportation, which reduces single vehicle car use.
Benefits to Climate Change Adaptation
Reduce exposure of a vulnerable population (the elderly) to air pollution.
Continue to Extreme Heat Example.
Go Back to Main Post.
Copyright: © Biositu, LLC, and Building Public Health, 2015.
Four Examples of Designs that Reduce the Site-Specific Health Risks of Climate Change

The health effects of climate change have been in the news this summer.
Over the course of three weeks:
-
Pope Francis released the first-ever encyclical letter calling for immediate and sustained action to mitigate climate change and protect the most vulnerable from exposure to climatic events.
-
The prestigious Lancet Commission on Health and Climate Change released its 2015 report, which couches climate change as the most significant community health opportunity of our generation.
-
And, the White House hosted a summit, which resulted in the release of eight actions to protect communities from the health effects of climate change.
Green building design can help protect occupants from the negative health effects of climate change. However, the level of risk shifts from location to location in response to changes in the environmental, demographic, and community health context.
Click on the links below to read about four examples of the role design can play in protecting building occupants from the contextual health risks of climate change.
Note: The health impact statements in each example have been paraphrased from the Human Health section in the 3rd National Climate Assessment.
Are you interested in learning about how this type of assessment can benefit your design project or existing facility? Contact us at This email address is being protected from spambots. You need JavaScript enabled to view it. for additional information about our services and a free initial consultation.
Copyright: © Biositu, LLC, and Building Public Health, 2015.
Infrastructure Strategy: Mixed-Use Suburban Neighborhood Development, Eastern Temperate Forest Ecoregion
Visit the Overview blog post for an introduction to the Building Public Health Blog Library of Strategies.
Visit the Reference section below for the primary source of data incorporated into this blog post.
Context
The context for this proposed design strategy is a mixed-use suburban neighborhood development outside a north-central Connecticut town with roughly 30,000 residents and a median household income close to the 2009 national average of $50,221. The town’s dense, historic center is surrounded by low-density suburban residential neighborhoods that are serviced by shopping centers and big box retail stores located on major thoroughfares. A commercial and light industrial corridor was developed along 3-5 miles of a major roadway in the 1980’s. These businesses employ some local residents; however, many of their employees drive in from other suburbs, and many of the town residents commute to other towns and suburbs to work.
How Resilient Is The Surrounding Infrastructure?
Roads & Transit
-
Multiple transportation routes are available to and from the area, including the major North/South freeway that cuts through the state (Interstate 91), the Northeast Regional Amtrak rail with a nearby stop, CT Transit regional bus lines, and the planned New Haven/Hartford/Springfield commuter rail project.
-
Furthermore, bike lanes and trails, while incomplete, are readily available and increasingly developed in the area.
-
A regional airport is also located nearby.
Benefits & Risks – The site’s context is typical of many suburban areas in the U.S. in that it is extremely well connected to roads, but the transportation scale prioritizes cars over other forms of transportation. The level of density both in the site’s region and between the site and major employment hubs, however, merits the use of commuter rail and bike paths to a larger extent than suburbs in less densely populated regions.
Water Source and Distribution
-
Source – The development falls within the jurisdiction of The Metropolitan District (MDC), a non-profit municipal corporation established in 1929 that supplies potable water, wastewater, and stormwater services for Hartford and seven surrounding municipalities. The raw water is sourced from surface water in Connecticut and Massachusetts, most of which flows from watersheds that are owned and protected by the MDC into two large reservoirs about 20 miles from the site.
-
Quality – The MDC treats the water introduced into the potable water system using sand filtration, chlorination, fluoridation, pH adjustment, and corrosion control. An on-site laboratory tests for physical, chemical, and bacteriological contaminants in three locations: the reservoirs, the treatment plants, and designated sampling sites throughout the service area. The 2010 Water Quality Report indicates overall high water quality; however, three of 52 sites tested for lead were found to be above the maximum allowable concentration level of 15 ppb. Back flow prevention (i.e., cross-connection control devices) are required on sites using alternative water sources (such as rainwater collection) and for process water uses, such as irrigation, solar hot water systems, and geothermal wells.
-
Quantity – The MDC website and 2010 Water Quality Report offer water efficiency tips and encourage water conservation generally. However, other than a reported increase in residential irrigation, which may strain water supplies in the future, the services area appears not to suffer at the present from water scarcity.
Benefits & Risks – >The public water system provides access to high quality water; however, two-thirds of its water is treated using a system built in 1929. Furthermore, the distribution and sewer infrastructure was developed in the 1850’s. The system therefore suffers from the vulnerability common to all centralized utilities. The regulations designed to prevent cross-contamination to the public water supply may discourage or not allow installation of certain on-site water collection, treatment, and storage systems, further increasing the region’s vulnerability to loss or widespread contamination of its water supply if the historic water treatment facility is compromised.
Wastewater
-
The public wastewater collection system is also managed by MDC. A main treatment facility and three satellite facilities provide both primary and secondary treatment of effluent from sewers in the service area. All sludge is processed in the main facility in Hartford. Three of these facilities were awarded Gold Peak Performance Awards by the National Association of Clean Water Agencies to recognize 100% compliance with their national pollutant discharge elimination system permit in 2010.
-
The public water and wastewater system was initially developed in the 1850’s and suffers from both combined sewer overflows (CSOs) and sanitary sewer overflows (SSOs). The MDC has launched a program called The Clean Water Project with the goals of reducing the number of CSOs, eliminating SSOs, and reducing the levels of nitrogen entering water bodies by 2020. According to the MDC, the sewer separation project will coincide with other infrastructure upgrades such as utility upgrades and street resurfacing.
Benefits & Risks – The public wastewater system provides a high level of wastewater treatment at a low level of individual effort; however, according to the MDC, CSOs and SSOs lead to more than 50 instances a year of untreated sewage entering the Connecticut River. Also, as part of the region’s centralized water/wastewater system, it is vulnerable to the same concerns raised above in the Water section.
Electricity
-
Connecticut has deregulated its electrical power sector. It is therefore possible for property owners to choose which power company to contract with, including companies that offer renewable energy options. The CT Clean Energy Options Program assists consumers in supporting renewable power by purchasing it through their electric service provider. The Connecticut Clean Energy Fund has established a Clean Energy Communities program that rewards communities that have increased the percentage of renewable power purchased both by the municipal government and by utility customers.
-
The state of Connecticut has instituted a number of policies and programs to incentivize distributed renewable power installations and electric vehicles. For example, the Clean Energy Incentives Program and the Connecticut Energy Efficiency Fund offer rebates and other incentives to residential and commercial/institutional projects that install solar PVs, solar thermal systems, geothermal and heat pump systems, and even small wind generation systems. The Electric Vehicles (EV) Infrastructure Council is charged with overseeing the development of an infrastructure to support EVs and incentivizing their purchase by residents. The Customer-Side Distributed Generation Program offers low interest loans to electric generation and/or conservation projects ≥ 50 kW. It also awards valuable renewable energy credits to applicable generation projects.
Benefits & Risks – Currently, most of the state of Connecticut relies on the centralized electric grid for all of their electric power. However, the state is actively incentivizing the installation of distributed energy generation, particularly from renewable sources. The size of a typical mixed-use suburban neighborhood development would increase the array of electric generation options open to it, some of which could be specific to a building site while others might service the entire development.
Climate Change Impacts
The Adaptation Subcommittee to the Governor of Connecticut’s Steering Committee on Climate Change used downscaled climate models developed by the New York Panel on Climate Change to identify the following climatic changes in the 21st century:
-
Temperature – Annual average temperatures in Connecticut are projected to rise from 4-7.5 °F. The frequency, duration, and intensity of heat waves may also increase, while extreme cold events may reduce in frequency.
-
Precipitation – The total amount of precipitation may increase by 5-10%; however, it is projected to fall more often in the form of severe rain events, causing flooding.On the other end of the spectrum, droughts are also expected to increase in frequency, duration, and intensity.
-
Sea Level Rise – Sea levels are projected to rise by 12-23 inches, causing the coastal areas to be more vulnerable to flooding threats associated with extreme storm events. Under the “Rapid Ice-Melt Sea Level Rise” scenario, the sea level may increase by 41-55 inches.
Based on these projections, the subcommittee predicted that the following types of infrastructure will be negatively impacted by climate change:
-
Coastal flood control and protection
-
Dams and levees
-
Stormwater infrastructure
-
Transportation infrastructure (including airports, water ports, railroads, and roadways)
-
Facilities and buildings (including telecommunication, electric generation, interstate gas pipelines, and solid waste management, in addition to vital buildings such as hospitals and fire stations)
Imagine You Were Designing a Mixed-Use Suburban Neighborhood Development in this Community…
Based on the information listed above regarding the current condition of the community and regional infrastructure and its likely future as the climate continues to change, you might consider starting the design process by asking questions such as:
-
Why do the majority of employees along the commercial corridor adjacent to the site choose to commute 30 minutes to work everyday? What amenities are available in their neighborhoods that are not present in the neighborhood surrounding the site? How might you entice them to live closer to work?
-
What are the gaps in the current transportation network that prevent the employees in adjacent businesses from using a combination of public transit and active transportation (i.e., walking and cycling) to commute to and from work? What are the transportation barriers for area residents?
-
How vulnerable is the site to disruption in water supply, electricity, telecommunications, solid waste pick up, and other utilities during an extreme weather event? Are there opportunities to reduce or offset this vulnerability by providing some of these services on-site?
-
Which on-site utilities (such as water collection, energy generation, composting, etc.) should be considered for the entire neighborhood development? Which should be encouraged for specific building projects?
-
What incentives and variances are available through state and local funding sources to help offset the cost of installing energy- and water-efficiency measures, on-site renewable energy generation, etc.?
-
Could the project register as a pilot program for new and innovative technologies that are being developed by companies headquartered in Connecticut? How might this type of program enhance the project's appeal to area landowners, businesses, and future tenants/homeowners?
The answer to these questions might result in solutions similar to the following list of design recommendations, which have been organized to highlight their relevance to building codes, green building programs, and greenhouse gas emissions reduction programs.
|
Design Recommendations |
Relevance to… |
|
|
|
|
Building/Planning Codes |
Green Building Programs |
GHG Emissions Programs |
|
1. Provide a range of housing types (multi-family, single family attached, single family detached); sizes (studio, 1-bedroom, multiple bedrooms); and, costs. Focus on the housing types favored by employees of nearby businesses who currently commute long distances to work. |
Building code may require certain densities, number of parking spaces, etc., that limit the variety of housing options in the area. |
LEED for Neighborhood Development encourages this approach. |
Enticing employees of nearby businesses to live close to work can help the township achieve status as a CT Clean Energy Community. |
|
2. Design the development to fill in transportation gaps wherever possible. For example, install bike paths and sidewalks. Work with the regional bus system to connect the site to the commuter rail station, the historic downtown area, and regional shopping centers. |
This strategy may help support a request for a variance to reduce the minimum number of parking spots required for the development. |
Alternative transportation. |
Reduces emissions by reducing the number of trips made in single-occupancy vehicles. |
|
3. Design the site landscaping to retain, filter, and reuse stormwater on-site to reduce erosion, the risk of flooding, and compromising river water quality. |
Coordinate with the MDC’s Clean Water Project. (add link) |
Erosion control. Stormwater mitigation. Water efficient landscaping. |
Reduces emissions by reducing the volume of water processed by the wastewater treatment plant. |
|
4. Maximize the efficiency of water fixtures and eliminate potable water use for landscape irrigation. |
Rebates and incentives may be available to help finance some new technologies. |
Water use reduction. Water efficient landscaping. |
Reduces emissions by reducing demand on the public water system. |
|
5. Pilot test distributed wastewater technologies to reduce demand on the central wastewater system. |
Codes will govern the level of treatment required and the type of usage allowed. Coordinate with the MDC’s Clean Water Project. (add link) |
Wastewater use reduction. |
Reduces emissions by reducing demand on the public wastewater system. |
|
6. Investigate options for on-site rainwater collection, filtering, storage, and reuse. |
Codes will govern the level of treatment required and the type of usage allowed. Health and safety codes may not allow rainwater inside buildings. |
Erosion control. Stormwater mitigation. Water efficient landscaping. Water use reduction. |
Reduces emissions by reducing demand for potable water and reducing the volume of water processed by the wastewater treatment plant. |
|
7. Work with the local public health agency to test the filtration level of onsite water collection and wastewater treatment so that the development is authorized to use it as drinking water. |
Codes will govern the level of treatment required and the type of usage allowed. |
Stormwater mitigation. Water efficient landscaping. Water use reduction. Wastewater use reduction. |
Reduces emissions by reducing demand for potable water and reducing the volume of water processed by the wastewater treatment plant. |
|
8. Investigate options for on-site renewable energy sources. |
Incentives may be available to help fund on-site renewable energy installations and pilot projects. |
On-site renewable energy. |
Reduces emissions by replacing demand for conventional electricity sources with emissions-free energy. |
|
9. Investigate options for an on-site composting program and community garden. |
Codes will govern composting activities. |
Waste reduction. Water efficient landscaping. Water use reduction. |
Reduces emissions by reducing food miles traveled and the energy associated with transporting solid waste. |
|
10. Require all residential buildings in the development to be designed as net-zero energy homes and all commercial buildings to be designed to support passive survivability during an extreme weather event. |
Incentives may be available to help fund energy efficiency, water efficiency, and on-site renewable energy strategies. |
Energy optimization. Water use reduction. On-site renewable energy. |
Reduces emissions by reducing demand on the central energy and water systems and by replacing demand for conventional electricity sources with emissions-free energy. |
References
Adaptation Subcommittee to the Governor’s Steering Committee on Climate Change (April 2010), The Impacts of Climate Change on Connecticut Agriculture, Infrastructure, Natural Resources and Public Health (link)
Connecticut Clean Energy Fund (link)
Connecticut Clean Energy Incentives Program (link)
Connecticut Customer-Side Distributed Generation Program (link)
Connecticut Energy Efficiency Fund (link)
Connecticut Electric Vehicles (EV) Infrastructure Council (link)
CT Clean Energy Options Program, available at: (link)
CT Transit (link)
The Metropolitan District (MDC) (link)
New Haven/Hartford/Springfield commuter rail project (link)
U.S. Census (link)
U.S. EPA Level I Ecoregions (link)
Are you interested in learning about how this type of assessment can benefit your design project or existing facility? Contact us at This email address is being protected from spambots. You need JavaScript enabled to view it. for additional information about our services and a free initial consultation.
Copyright: © Biositu, LLC, and Building Public Health, 2011.
Infrastructure Strategy: Rural Health Clinic, Tundra/Taiga Ecoregion
Photo Credit: Aqvaluq Photography
Visit the Overview blog post for an introduction to the Building Public Health Blog Library of Strategies.
Visit the Reference section below for the primary source of data incorporated into this blog post.
Context
The context for this proposed design strategy is a remote community in Northeast Alaska with a population of roughly 500 residents from the Inupiat tribe. The economy relies mainly on subsistence activities (i.e., hunting, gathering, and fishing). The modern community was founded in 1939 as part of the Indian Reorganization Act; however, residents relocate to temporary camps closer to the coast during the summer months.
How Resilient Is The Surrounding Infrastructure?
Roads & Transit
-
Transportation routes to and from the community rely on water: ice in the winter and river navigation in the summer. Both routes are being disrupted via shorter sea and river ice in the winter and low water levels in the summer.
-
Barge service is not possible due to low water levels.
-
Airplane cargo transport is expensive.
Benefits & Risks – The relative remoteness of the village enables residents to pursue a subsistence economy with minimal encroachment from other economic activities. However, dependence on a seasonal transportation infrastructure risks an increasing number of disruptions as the climate warms, possibly leading to rising prices and shortages in fuel, food, and other supplies.
Permafrost
-
Critical infrastructure has become vulnerable to subsidence and erosion as the permafrost melts unevenly.
Benefits & Risks – Construction techniques can attempt to minimize the likelihood of further permafrost melt; however, they cannot reverse the overall trend.
Water Source and Distribution
-
Source – The community sources water from three shallow wells located in the Noatak River. Low water levels have led to occasional seasonal water shortages.
-
Quality – Water quality has been compromised in two ways: through increased turbidity in the river caused by erosion from heavy precipitation events and through the introduction of landfill waste in the river caused by bank erosion. Increasing levels of giardia lamblia and cryptosporidium have been detected at the water treatment plant, increasing water filtration costs to an unsustainable level. Traditional water sources also can be contaminated with pathogens such as giardia lamblia.
-
Quantity – The community water treatment plant was constructed in 1995 with storage designed to service a population of 486 for 3 days; however, the population connected to the water supply currently exceeds 500. Roughly 70% of homes are connected to the public water system. The rest continue to haul water and use honey buckets to treat waste.
-
Structural Integrity – The community water treatment plant was constructed with a reinforced concrete slab foundation on an insulated gravel pad and ten thermosyphons that remove heat from the ground to prevent the permafrost from thawing. In spite of these measures, the permafrost has thawed to a depth of 5-10 feet, compromising the foundation. Contributing factors: warm pipelines, drifting snow, rainwater runoff, solar heat gain. Breaks in the water main have averaged >1 per year over the past decade and are increasing. Breakages are attributed to thawing permafrost and appear to coincide with increasing air temperature.
Benefits & Risks – The public water system provides access to high quality water; however, the treatment plant is over capacity, is extremely energy-intensive, and suffers from increasing vulnerability to structural failures due to melting permafrost.
Wastewater
-
The public wastewater collection system was constructed in 1992 to service the sites connected to the public domestic water system and includes a 7,500 linear foot sewer main, arctic pipe cleanouts, and a system of manholes.
-
Septic tanks perform primary treatment, and the resulting effluent is discharged to a 50,000-gallon lagoon before flowing down into a 3-acre tundra pond for secondary treatment. Waste sludge is deposited in the community landfill.
-
Similar to the potable water system, the public wastewater system suffers from sagging sewer pipes and settling manholes.
Benefits & Risks – The public wastewater system provides a higher level of wastewater treatment at a lower level of individual effort than the traditional honey bucket system; however, similar to the potable water system, it is extremely energy-intensive, and suffers from increasing vulnerability to structural failures due to melting permafrost.
Stormwater Mitigation
-
Thawing permafrost and increased severity of precipitation events are causing flooding damage to fragile riverbanks and coastlines.
Benefits & Risks – Risks associated with increased stormwater include injury, compromised water quality, risk of mold growth in flooded structures, and reduced subsistence food supplies.
Imagine You Were Designing a Replacement Health Clinic in this Community…
Based on the information listed above regarding the current condition of the community water infrastructure and its likely future as the climate continues to change, you might consider starting the design process by asking questions such as:
-
Considering its structural problems and capacity constraints, should we connect to the central water & wastewater system at all?
-
What alternatives exist for water collection, treatment, and storage?
-
How can we conserve water?
-
What type of water efficient fixtures function in this area? Can we obtain them?
-
Can we treat and store water on-site to multiple levels of purity based on the use it will be put to?
-
What is the best way to design a foundation that may sit on permafrost today but will likely need to transition to a floating foundation in a few years?
-
How will that transition affect the water and sewer pipes? Do they need to be located above ground instead of below ground?
-
What can we learn from the way water is conveyed, treated, and disposed at the community’s seasonal subsistence camps that will help the permanent community become more resilient to climatic changes?
The answer to these questions might result in solutions similar to the following list of design recommendations, which have been organized to highlight their relevance to building codes, green building programs, and greenhouse gas emissions reduction programs.
|
Design Recommendations |
Relevance to… |
|
|
|
|
Building/Planning Codes |
Green Building Programs |
GHG Emissions Programs |
|
1. Design the site landscaping to retain, filter, and reuse stormwater on-site to reduce erosion, the risk of flooding, and compromising river water quality. |
Codes will govern the level of treatment required and the type of usage allowed. |
Erosion control. Stormwater mitigation. Water efficient landscaping. |
Reduces emissions by reducing the volume of water processed by the wastewater treatment plant.
|
|
2. Maximize the efficiency of water fixtures. Investigate whether a hybrid technology between traditional flush toilets and honey buckets might be implemented successfully on-site. |
Health and plumbing codes guidelines may restrict efficiency technologies in certain areas of the clinic.
|
Water use reduction. |
Reduces emissions by reducing demand on the public water system. |
|
3. Design underground water pipes with flexible connections to minimize the likelihood of breakages in the event of uneven settlement due to melting permafrost. |
Building codes in regions with floating foundations may provide guidance on best practice technologies.
|
Increasing longevity of building structures and water infrastructure. |
Reduces emissions by reducing waste in the public water system caused by leaks. |
|
4. Install foundation monitors and built-in leveling devices to facilitate conversion to a floating system when the permafrost melts. |
Building codes in regions with floating foundations may provide guidance on best practice technologies.
|
Increasing longevity of building structures and water infrastructure. |
Reduces emissions by reducing the need to retrofit and/or rebuild foundations and infrastructure. |
|
5. Pilot test distributed wastewater technologies to reduce demand on the central wastewater system. |
Codes will govern the level of treatment required and the type of usage allowed.
|
Wastewater use reduction. |
Reduces emissions by reducing demand on the public wastewater system. |
|
6. Investigate options for on-site rainwater and snow storage, including whether the health clinic should manage its water supply and wastewater autonomously or whether an on-site water and wastewater system might service the surrounding neighborhood. |
Codes will govern the level of treatment required and the type of usage allowed. |
Erosion control. Stormwater mitigation. Water efficient landscaping. Water use reduction. |
Reduces emissions by reducing demand for potable water and reducing the volume of water processed by the wastewater treatment plant.
|
|
7. Work with the local public health agency to test the filtration level of onsite water collection and wastewater treatment so that the development is authorized to use it as drinking water. |
Codes will govern the level of treatment required and the type of usage allowed. |
Stormwater mitigation. Water efficient landscaping. Water use reduction. Wastewater use reduction. |
Reduces emissions by reducing demand for potable water and reducing the volume of water processed by the wastewater treatment plant.
|
|
8. Investigate options for on-site renewable energy sources that could power an on-site water and/or wastewater system. |
Incentives may be available to help fund on-site renewable energy installations. |
On-site renewable energy. Stormwater mitigation. Water efficient landscaping. Water use reduction. |
Reduces emissions by reducing energy demand, reducing potable water demand, and reducing the volume of water processed by the wastewater treatment plant. |
Reference
Climate Change in Noatak, Alaska: Strategies for Community Health. (2011) Alaska Native Tribal Health Consortium Center for Climate and Health. Available at: http://www.anthc.org/chs/ces/climate/upload/Climate_Change_in_Noatak_Strategies_for_Community_Health.pdf
U.S. EPA Level I Ecoregion Website. Available at: http://www.epa.gov/wed/pages/ecoregions/na_eco.htm
Image Credit: (C) Aqvaluq Photography.
Image available at: http://i149.photobucket.com/albums/s63/tundratantrum/noataktrip8.jpg
Tundratantrum blog, Keeping it Real at 66 Degrees North Latitude.
Are you interested in learning about how this type of assessment can benefit your design project or existing facility? Contact us at This email address is being protected from spambots. You need JavaScript enabled to view it. for additional information about our services and a free initial consultation.
Copyright: © Biositu, LLC, and Building Public Health, 2011.
Next Generation of Sustainable Water Solutions - Resources and Presentation Synopsis
 Adele Houghton's presentation at the inaugural SXSW Eco conference this week, "John Snow’s Legacy: the Next Generation of Sustainable Water Solutions," proposed a new model for water management that capitalizes on collaboration between public health regulators, climate change policy makers, and green building practitioners.
The talk, which reviewed the link between water and public health and the impact that climate change is likely to have on global water resources, concentrated on innovative approaches to managing water supplies sustainably while continuing to protect the public from exposure to the waterborne pathogens that were major killers as recently as 1900.
This blog post offers a brief synopsis of the talk as well as links to reference information and useful resources.
Introduction
The origins of modern day public health lie in sanitation, most famously exemplified by Dr. John Snow’s observation that Cholera outbreaks in mid-nineteenth century London appeared to be associated with contaminated water sources. Since that time, many innovations in building and infrastructure technology have been driven by health concerns. Today, however, public health regulations are often regarded as impediments to innovation rather than as useful safeguards of the public’s health. Building on public health’s evidence-based approach to managing water resources, this presentation will introduce a new, collaborative model for developing innovative solutions to one of sustainability’s most pressing challenges.
Water and Public Health
From 1900 to 2000, the leading causes of death in the US changed from infectious diseases to chronic, non-communicable diseases. In 1900, the top three causes of death were infectious disease, two of which include water as a pathway. By 1998, the first infectious disease on the list, pneumonia, has dropped to number 6. Regulations improving water quality and sanitation practices greatly contributed to the reduction in mortality associated with infectious disease.
Resources
CDC, Leading Causes of Death, 1900-1998.
CDC, Top 5 Causes of Drinking Water Outbreaks in the US from 1971-2006.
Water and Climate Change
Climate predictions indicate that we are headed towards a world where both energy and water will become more scarce and where natural disasters that threaten the ability of our sanitary systems to function will become more frequent and more severe.
Resources
Bernstein et al. (2007). Climate Change 2007: Synthesis Report, An Assessment of the Intergovernmental Panel on Climate Change.
Global Climate Change Impacts in the United States: A State of Knowledge Report from the U.S. Global Change Research Program (2009).
Greer, et. al. (2008). Climate change and infectious diseases in North America: the road ahead. CMAJ. 178(6):715-22.
Robert Wilkinson, Analysis of the Energy Intensity of Water Supplies for West Basin Municipal Water District (2007).
Sandia National Laboratories, Energy-Water Nexus Web Page.
A New Approach to Sustainable Water Solutions
COMMUNITY SCALE: North Texas Municipal Water District East Fork Wetland Project
The North Texas Municipal Water District East Fork Wetland Project demonstrates how in direct potable water reuse technologies can be instituted successfully. The project diverts 91 million gallons per day of water from the east fork of the Trinity River to flow through a 1,840 acre constructed wetland, using aquatic plants to remove harmful contaminants. The purified water is then pumped 43 miles to Lake Lavon, where it is treated to potable water standards along with other raw water sources and delivered to customers in the Dallas-Fort Worth metro area.
This kind of project, which integrates environmental and climate change benefits into the existing water purification infrastructure, is a perfect candidate for collaboration with local public health officials. Psychologists have found that scientific evidence is not sufficient to convince people that something that triggers revulsion (such as drinking purified human sewage, or, as opponents like to call it, toilet to tap) is actually safe. However, introducing a few intermediate steps that separate the source of perceived contamination (the toilet) from the end product (the tap), can drastically increase acceptance of a technology or practice that previously had be viewed as unacceptable. (Dingfelder, 2004)
The role of public health in this setting is, first, to test and monitor the system to ensure that the wetlands are purifying the water to the intended level. Second, they should be incorporated into the facility’s communications and education strategy. A wetland that purifies effluent can be used as the basis for educating the public about where their water comes from, what types of tests are performed to verify its safety, and the complex relationship between the city’s drinking water system and the region’s overall hydrological cycle. These kinds of messages reinforce the priorities of all three groups: the need to maintain a high level of water quality, the need to reduce carbon emissions, and the need to act as stewards of the environment.
Resources
Case Study of North Texas Municipal Water District East Fork Wetland Project on North Texas Municipal Water District website.
Case Study of North Texas Municipal Water District East Fork Wetland Project on the John Bunker Sands Wetland Center website.
Sadie F. Dingfelder, From toilet to tap: Psychologists lend their expertise to overcoming the public's aversion to reclaimed water. (2004) APA Monitor. 35(8):26.
Lorie Woodward Cantu, John Bunker Sands Wetland Center, Texas Wildlife, August 2011: 46-50.
NEIGHBORHOOD/DEVELOPMENT SCALE: Central Texas Climate Change Environmental Public Health Indicators Project
This pilot project, located in Austin, Texas, demonstrates how public health participation in climate change and green building policies can reduce community vulnerability. The Central Texas Climate Change Environmental Public Health Indicators Project uses a GIS portal to provide the community and local policymakers with a source of visual analysis for how vulnerable populations and the environment could be impacted by proposed climate action policies. Its goal is to raise awareness among the general public about the links between climate change and public health.
Based on an historical evaluation of which natural hazards had resulted in the highest mortality rates in Travis County from 1970-2004, the project team developed two climate change indicators for the pilot phase: extreme heat events and flash flooding events.
This type of tool provides neighborhood-specific information about the environmental and health hazards associated with climate change. When a downscaled climate model is added, policymakers and planners could use the tool to perform a health impact assessment of future land use planning schemes (such as the comprehensive plan) – identifying which areas of town are likely to become more or less vulnerable to the effects of climate change over time.
It could also act as an educational tool for outreach to neighborhood associations, explaining the links between climate change and human health and the reasons a particular neighborhood has been identified as vulnerable to flooding. By providing background information and information about things the neighborhood could do to reduce their vulnerability, it could galvanize neighborhood associations to work together to reduce their vulnerability through activities such as: clearing out gullies, increasing low-impact stormwater strategies, and instituting a buddy program to check up on particularly vulnerable neighbors during flash flood events.
Resources
Borden, K. A., & Cutter, S. L. (2008). Spatial patterns of natural hazards mortality in the United States. International Journal of Health Geographics. 7(64). doi: 10.1186/1476-072X-7-64.
CIDRAP, ASTHO, Using Vulnerability Maps to Inform Local Public Health Policies and Climate Change Adaptation Efforts (TX).
GEMSS (Geospatial Emergency Management Support System), a project of TNRIS (Texas Natural Resources Information System).
Houghton, A.; Prudent, N.; Scott III, J. E.; Wade, R.; Luber, G. (2011). Climate change-related vulnerabilities and local environmental public health tracking through GEMSS: A web-based visualization tool. Applied Geography (in press). doi:10.1016/j.apgeog.2011.07.014.
SITE SCALE: On-Site Rainwater Capture, Treatment, and Reuse
The energy intensity associated with the municipal water system (from treatment to pumping), coupled with the increasing threat of being overwhelmed by natural disasters such as hurricanes and tornadoes, makes the concept of flipping our current water system from a centralized, uni-directional system to a distributed, multi-directional system more economically and politically feasible than in the past.
The concept of net zero water is similar to net zero energy: using a combination of water efficiency strategies and onsite water collection, treatment, storage, and reuse strategies to generate a development's water supply.
The 2011 Texas legislature passed two bills that expand the sources of potable water available to developments connected to the public water supply. HB 3391 allows developments to be designed to use harvested rainwater as their sole source of water supply. HB 3372 allows rainwater to be used as an indoor potable water source for structures connected to a public water system. Currently, no federal or state standards exist for harvested rainwater quality. These two bills therefore offer an ideal opportunity for local and state public health agencies to collaborate with TCEQ and the climate change community to develop reasonable guidelines for regulation that will safeguard the public's health without imposing requirements that are overly onerous -- either economically or technologically.
Resources
Texas HB 3391
Texas HB 3372
Texas A&M AgriLife Extension Website, Rainwater Harvesting Web Page.
Texas Water Development Board Website, Rainwater Harvesting Web Page.
Toward Net Zero Water: Best Management Practices for Decentralized Sourcing and Treatment. (2011) Cascadia Green Building Council.
Conclusion
The American culture has been so thoroughly convinced that modern sanitation practices protect them from the threat of waterborne diseases such as cholera, that the concept that they might once again rise to the level of major killers is largely rejected by mainstream society. However, climate change, population growth, land use parctices, and overconsumption have placed our centralized public water systems in peril. A new approach is needed to maintain access to high quality water in the future.
Each of the examples in this talk take an integrated approach to water management:
-
Identify and control the potential source of contamination (the primary goal of public health)
-
Reduce the carbon footprint associated with the water source (which will help communities meet their climate change objectives)
-
Design the human intervention to expand native habitat, enhance biodiversity, and restore the natural hydrological cycle (a fundamental goal of green building projects)
Examples such as these offer a model for the future of sustainable water management in the era of climate change.
Copyright: © Biositu, LLC, and Building Public Health, 2011.
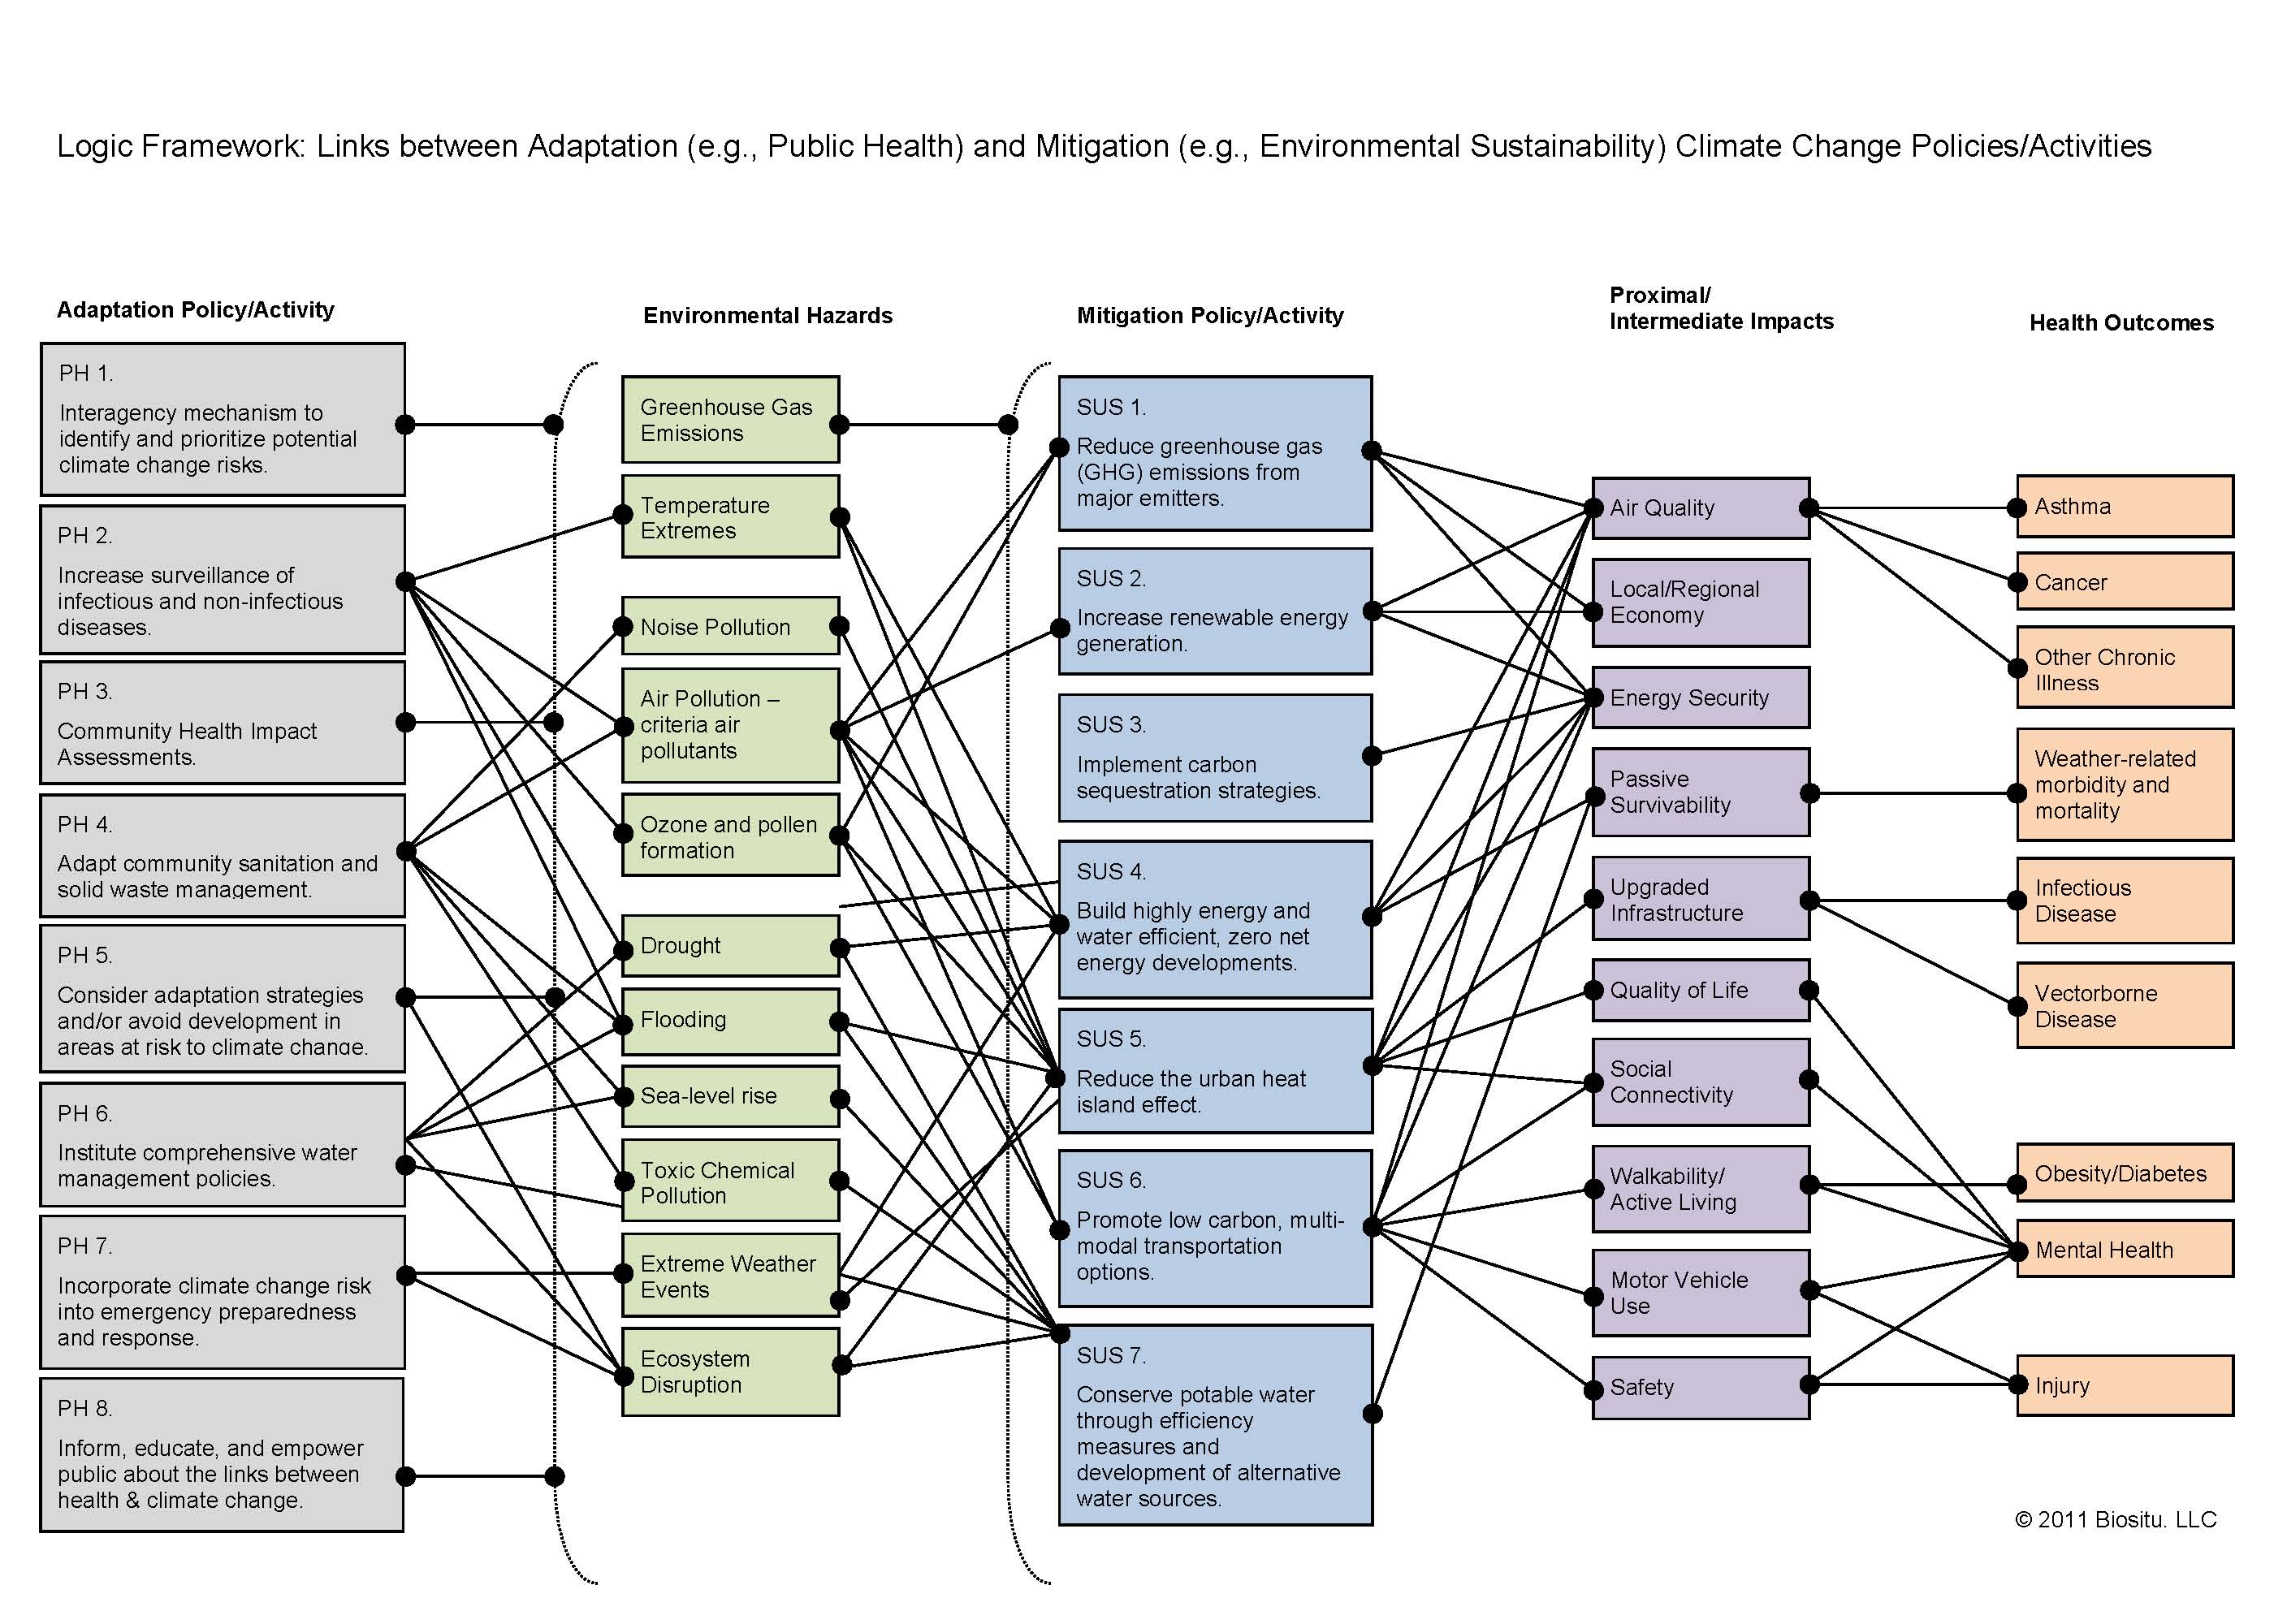
Scrambling Climate Change Categories: Understanding the Public Health and Sustainability Co-Benefits of Crossing Adaptation and Mitigation Boundaries (part 3 of 3)
The third in a three-part series of blog posts, this post illustrates a web of interconnections between the climate change adaptation and mitigation policies and activities outlined in parts 1 and 2.
The logic framework below highlights potential environmental and health co-benefits by tracing links between the following categories:
-
Adaptation policies/activities
-
Environmental hazards
-
Mitigation policies/activities
-
Proximal/Intermediate Impacts
-
Health outcomes
Diagrams such as this one can be used to identify relevant causal pathways between public health, environmental, economic, and climate change priorities. By mapping out how a single metric such as concentrations of criteria air pollutants can act as an indicator for multiple policies, this approach can support integration of two policy initiatives (adaptation and mitigation) that have too often been separated.
Copyright: © Biositu, LLC, and Building Public Health, 2010.
Scrambling Climate Change Categories: Understanding the Public Health and Sustainability Co-Benefits of Crossing Adaptation and Mitigation Boundaries (part 2 of 3)
The second in a three-part series of blog posts, this post reviews the traditional role of sustainability in climate change activities. Part 3 will connect the dots between the adaptation and mitigation strategies outlined in parts 1 and 2.
The following mitigation activities fall within the traditional role of environmental sustainability:
1. Reduce greenhouse gas (GHG) emissions from major emitters such as power plants, landfills, refineries, cement production facilities, buildings, and transportation.
Link to Environmental Sustainability
The most direct way to slow global warming will be to reduce the amount of GHG emitted to the atmosphere by human activities. According to the Intergovernmental Panel on Climate Change Fourth Assessment Report released in 2007, the rising average temperatures associated with climate change have already affected the environment, compromising biodiversity and threatening natural resources such as access to fresh water.
Sample Locations
National
U.S. EPA: On September 30, 2009, the U.S. EPA proposed instituting mandatory federal emission limits for the largest emitters: facilities emitting >25,000 tons of GHG annually. The EPA estimates that this program will address 70% of national GHG emissions from stationary sources. (link)
U.S. Mayors Climate Protection Agreement: Item 1, “Inventory global warming emissions in City operations and in the community, set reduction targets and create an action plan.” (link)
California
California Assembly Bill 32 (CA AB32) Global Warming Solutions Act of 2006: Targets reducing statewide GHG emissions to 1990 levels by 2020. (link)
Targeted sectors include:
-
Agriculture: targeted sources of GHG emissions include manure, fertilizer, offroad equipment
-
High Global Warming Potential (GWP): targets sources emitting GHGs with higher climate impact than CO2. For example, consumer products, fire protection systems, insulating foams, and a variety of refrigerants (mobile air conditioning, residential refrigeration, stationary refrigerants, etc.)
-
Industry and Manufacturing: Energy efficiency and GHG emissions audit for facilities emitting >0.5 million metric tons of carbon dioxide equivalent (MMTCO2E) annually.The currently targeted industries are semiconductors, cement, and glass manufacturing.
-
Oil & Gas Refining: activities include establishing a low carbon fuel standard, surveying oil and natural gas emissions from 2007 to develop an inventory baseline for the industry, and identifying mitigation strategies for natural gas transmission/distribution and refineries.
-
Waste Management/Recycling: targets areas such as commercial recycling, reducing organics in the waste stream, methane emissions from landfills, and anaerobic digestion.
California Cap-and-Trade Program: This program was created to speed compliance with CA AB32. AB32 requires that it launch by January 2011. It is being developed in coordination with the Western Climate Initiative with the goal of contributing to a regional cap-and-trade program. (link)
The November 2009 Preliminary Draft Regulation proposes covering the following sectors:
By 2012: electricity generation (including imports) and industrial sources/processes ≥ 25,000 metric tons of CO2 equivalents (MTCO2e)
By 2015: industrial fuel combustion at facilities with emissions < 25,000 MTCO2e and transportation fuels
Chicago
Chicago Climate Action Plan: Meet the Kyoto Protocol targets by reducing GHG emissions to 80% below 1990 levels by 2050. The plan targets five strategies: energy efficient buildings, clean and renewable energy sources, improved transportation options, reduced waste and industrial pollution, and adaptation. (link)
New Hampshire
Climate Action Plan 2009: Meet the Kyoto Protocol targets by reducing GHG emissions to 80% below 1990 levels by 2050. The plan targets the following sectors: buildings, renewable energy generation, transportation, and carbon sequestration through protection of natural resources. (link)
New York City
plaNYC 2007: Reduce GHG emissions by > 30% by 2030 by avoiding sprawl, investing in clean power, reducing building energy consumption, and enhancing sustainable transportation options. (link)
Seattle
Seattle Action Plan 2006: Targets citywide compliance with the Kyoto Protocol target – a 7% reduction in GHG emissions over 1990 levels by 2012 and an 80% reduction by 2050. If Seattle maintains its 2008 levels, it will meet the 2012 goal. Over 60% of Seattle’s GHG emissions can be linked to transportation emissions, leading it to focus on increasing vehicle efficiency and expanding transportation options. (link)
2. Increase renewable energy generation.
Link to Environmental Sustainability
Renewable energy reduces the need to rely on fossil fuels for energy production, avoiding the release of GHG emissions such as CO2, CH4 (methane), and N2O (nitrous oxide). For additional information, see the U.S. EPA Inventory of U.S. Greenhouse Gas Emissions and Sinks and Union of Concerned Scientists.
Sample Locations
National
U.S. Mayors Climate Protection Agreement: Item 3, “Increase the use of clean, alternative energy.” (link)
California
California Assembly Bill 32 (CA AB32) Global Warming Solutions Act of 2006: Targets reducing statewide GHG emissions to 1990 levels by 2020. (link)
Targeted sectors include:
-
Renewable Portfolio Standard: California electric corporations must meet a 20% renewable energy procurement requirement by 2010.
Chicago
Chicago Climate Action Plan, Renewable Energy Sources mitigation strategy: Targets using renewable energy procurement to reduce total electricity emissions by 20%, increasing distributed generation and combined heat and power to increase the efficiency of electricity generation, and doubling residential renewable energy generation. (link)
New Hampshire
Renewable Energy Act 2007: Requires electricity suppliers in New Hampshire to procure ≥ 25% of total electricity from renewable sources by 2025. (link)
Participation in the Regional Greenhouse Gas Initiative (RGGI), which has capped GHG emissions and will reduce total emissions from the power sector by 10% by 2018. (link)
New York City
plaNYC 2007: Promotion of renewable power sources is one of the City’s strategies to meet its goal of reducing global warming emissions by > 30% by 2030. (link)
Seattle
Seattle Action Plan 2006: 90% of Seattle’s electricity is generated by carbon-neutral hydroelectric dams. GHG emissions from the remaining 10% are offset through the purchase of carbon-offset certificates. The Action Plan targets maintaining electricity production at the municipally-owned Seattle City Lights at zero net GHG emissions. Increased load will be accommodated through conservation and renewable energy sources. Any additional emissions will be offset by purchasing carbon offset certificates. (link)
3. Implement carbon sequestration strategies, such as: afforestation/reforestation and conservation agricultural practices.
Link to Environmental Sustainability
Vegetation consumes CO2 through photosenthesis. It is therefore a possible mitigation strategy – a way to offset some of the GHGs emitted to the atmosphere each year. Natural vegetation also enhances environmental sustainability by promoting biodiversity, reducing erosion and stormwater contamination, and lowering surrounding temperatures through evapotranspiration. For additional information about carbon sequestration, visit the U.S. EPA website.
Sample Locations
National
U.S. Mayors Climate Protection Agreement: Item 11, “Maintain healthy urban forests; promote tree planting to increase shading and to absorb CO2.” (link)
California
California Assembly Bill 32 (CA AB32) Global Warming Solutions Act of 2006: Targets reducing statewide GHG emissions to 1990 levels by 2020. (link)
Current activities in the Forestry sector include:
-
Developing Forest GHG accounting protocols
-
Forest Emissions Inventory.
Chicago
Chicago Climate Action Plan, Energy Efficient Buildings mitigation strategy: Target installation of vegetated/living roofs on 6,000 buildings, and plant one million trees. (link)
New Hampshire
Climate Action Plan 2009: 84% of New Hampshire’s landscape is forested, providing a significant source of potential carbon sequestration capacity. The Action Plan recommends actions that will offer a net GHG emission reduction state-wide, including: investing in forested areas to avoid land conversion (AFW 1.2), protecting agricultural land (AFW 1.1.3), promoting durable wood products (AFW 1.3) and waste reduction (AFW 3.1), and optimizing regional use of biomass for electricity and heating (AFW 2.2). (link)
New York City
MillionTreesNYC: A plaNYC initiative to plant one million new trees in New York City within ten years. The program’s research arm identified calculating the sequestration benefits of the program as a major research goal at its 2009 workshop. (link)
Seattle
Seattle Green Partnership: This public-private venture is committed to restoring 2,500 acres of forested city park lands by 2025, adding 649,000 trees citywide. A 1999 study estimated that Seattle had lost 46% of its heavy tree cover and 67% of its medium tree cover from 1972 to 1996, resulting in a cost of $1.3 million per year in stormwater infrastructure and $226,000 per year in health costs associated with air pollution. Reforestation will potentially benefit the city both by removing CO2 and other pollutants from the air and by providing a source of revenue through the generation of carbon offset credits. Seattle Green Partnership estimates that each acre of conifer forest it restores will provide the City with $195,000 worth of carbon sequestration (at $6 per ton of CO2e). (link)
4. Build highly energy and water efficient, zero net energy developments.
Link to Environmental Sustainability
According to the U.S. EPA, the building sector (industrial, commercial, and residential) accounted for 19.5% of total U.S. GHG emissions in 2007. Developments that produce enough renewable energy on-site to contribute to the overall grid’s power supply an equal or greater amount of electricity as their demand are called “zero net energy.” This strategy takes advantage of energy and water efficient building design, multi-modal transportation planning, on-site renewable energy sources, and smart grid technology to reduce the electrical load on fossil fuel sources of power generation.
Sample Locations
National
U.S. Mayors Climate Protection Agreement: Item 2, “Adopt and enforce land-use policies that reduce sprawl, preserve open space, and create compact, walkable urban communities.” (link)
Austin
Austin Climate Protection Plan 2007: Upgrade building code to require: all new single-family homes to be constructed zero-net energy capable by 2015; 75% increased energy efficiency in all non-residential new construction by 2015; point of sale disclosure of opportunities for energy efficiency retrofits and upgrades. (link)
California
California Assembly Bill 32 (CA AB32) Global Warming Solutions Act of 2006: Targets reducing statewide GHG emissions to 1990 levels by 2020. (link)
Current activities in the Local Initiatives and Land Use sector include:
-
Encouraging local government and regional actions
-
Research into low carbon options for land use development
-
Establishing urban forest GHG reporting protocols.
Chicago
Chicago Climate Action Plan Energy Efficient Buildings mitigation strategies: 70% of Chicago’s GHG emissions can be linked to the building sector. Efficiency mitigation strategies include: 30% energy reduction in both new and existing buildings, water efficiency measures, and promotion of vegetated/living roofs. (link)
New Hampshire
Climate Action Plan 2009: Building heating and electricity use account for over 60% of energy use in New Hampshire. Recommendations targeting low-GHG emitting developments include: maximizing efficiency in new (RCI 1.1) and existing (RCI 1.2) buildings; updating energy codes (RCI 1.4); preserving the existing building stock (RCI 1.8); and, assessing fees, incentives and zoning rules to promote low-GHG developments (TLU 2.C.1, TLU 2.C2). (link)
Seattle
Seattle Action Plan 2006: Buildings and equipment accounted for 21% of Seattle’s GHG emissions in 2008. The majority of building emissions are due to the use of natural gas for heating, appliances, and hot water, because Seattle electricity is delivered to customers at net zero emissions. Building and transportation codes have been targeted to increase density and encourage energy and water efficiency while also supporting access to multiple modes of transportation. (link)
Action #1: Significantly Increase the Supply of Frequent, Reliable and Convenient Public Transportation
Action #2: Significantly Expand Bicycling and Pedestrian Infrastructure
Action #5: Expand Efforts to Create Compact, Green Urban Neighborhoods
Action #10: Substantially Increase Natural Gas Conservation
Action #11: Strengthen the State Residential Energy Code
5. Reduce the urban heat island effect.
Link to Environmental Sustainability
The urban heat island (UHI) effect refers to the tendency for urban areas with large swathes of impermeable surfaces to experience higher temperatures than rural areas. The higher temperatures can lead to more intensive use of air conditioning during the summer, intensified air pollution and GHG emissions, and impaired water quality. For more information about UHI, visit the U.S. EPA website.
Sample Locations
National
U.S. Mayors Climate Protection Agreement: Item 11, “Maintain healthy urban forests; promote tree planting to increase shading and to absorb CO2.” (link)
Austin
Austin NeighborWoods Program offers free tree planting along rights of way to build a tree canopy shading Austin’s streets. Over 4,000 trees are planted each year through the program. (link)
Austin Parks and Recreation Department Urban Forestry Program: Targets planting ≥ 1,000 trees per year. (link)
Chicago
Chicago Climate Action Plan, Energy Efficient Buildings mitigation strategy: Target installation of vegetated/living roofs on 6,000 buildings, and plant one million trees. (link)
New York City
New York City Regional Heat Island Initiative: A study sponsored by the New York State Energy and Research Authority (NYSERDA) calculated the relative effectiveness of existing UHI mitigation strategies in New York City. All of the following strategies were found to reduce ambient temperature, however the most effective strategy would combine tree planting along streets and in open spaces with installing vegetated/living roofs throughout the city. (link)
-
Urban forestry
-
Light surfaces (roofs, sidewalks, streets)
-
Vegetated/Living roofs
6. Promote low carbon, multi-modal transportation options.
Link to Environmental Sustainability
According to the U.S. EPA, the transportation sector accounted for 26.3% of total U.S. GHG emissions in 2007. Transportation infrastructure such as roads and railways can fragment wildlife habitats. Oil and other vehicle pollutants deposited on roadways are washed into the storm sewer and surrounding vegetation during rain events, compromising water quality. Road design is also often a determining factor in the success of sustainable developments. Pedestrian-friendly street widths and block sizes, in addition to the availability of contiguous sidewalks and multiple forms of alternative transportation can help raise the occupant density necessary to support the economic success of mixed-use, sustainable developments.
Sample Locations
National
U.S. Mayors Climate Protection Agreement: Item 3, “Promote transportation options such as bicycle trails, commute trip reduction programs, incentives for car pooling and public transit.” (link)
California
California Assembly Bill 32 (CA AB32) Global Warming Solutions Act of 2006: targets reducing statewide GHG emissions to 1990 levels by 2020. (link)
The Transportation sector targets transportation of both people and goods, such as:
-
Passenger vehicles: Increased fuel efficiency, Reflective glazing, Tire pressure, Feebates, Zero Emission Vehicles
-
Heavy-duty vehicles: Increased fuel efficiency, Hybrid requirements, Anti-Idling
-
Ports: Shore power for ocean-going vessels, Vessel speed, Cargo handling equipment
Chicago
Chicago Climate Action Plan, Transportation mitigation strategies (link):
-
Increase transportation options: 30% increase in public transit ridership, expand transit incentive programs, target one million walking and cycling trips per year, increase car share/carpool ridership, support the development of high-speed intercity passenger rail.
-
Efficiency and alternative fuels: Improve the efficiency of City of Chicago fleet vehicles, increase the use of alternative fuel sources, and advocate for higher federal fuel efficiency standards.
-
Other: Promote transit-oriented development and more efficient freight movement.
New Hampshire
Climate Action Plan 2009: Due to its largely rural character, the actions targeting reduction in vehicle-miles traveled in the New Hampshire Climate Action Plan focus primarily on improving and expanding local and intra-regional bus and rail service as well as the Park-and-Ride infrastructure. Other actions include expanding the state’s walking and cycling infrastructure. (link)
New York City
plaNYC 2007: Improve travel times and bring the entire transportation system into a state of good repair using the following strategies: expand the transit infrastructure, improve service on the existing infrastructure, promote additional modes of transportation such as cycling and ferries, and reduce congestion. (link)
Seattle
Seattle Action Plan 2006: Over 60% of Seattle’s GHG emissions can be linked to transportation emissions, leading it to focus on increasing vehicle efficiency and expanding transportation options for close to one half of its targeted actions. (link)
Action #1: Significantly Increase the Supply of Frequent, Reliable and Convenient Public Transportation
Action #2: Significantly Expand Bicycling and Pedestrian Infrastructure
Action #3: Lead a Regional Partnership to Develop and Implement a Road Pricing System
Action #4: Implement a New Commercial Parking Tax
Action #5: Expand Efforts to Create Compact, Green Urban Neighborhoods
Action #6: Improve the Average Fuel Efficiency of Seattle’s Cars and Trucks
Action #7: Substantially Increase the Use of Biofuels
Action #8: Significantly Reduce Emissions from Diesel Trucks, Trains, and Ships
7. Conserve potable water through efficiency measures and development of alternative water sources.
Link to Environmental Sustainability
Warming temperatures can lead to changes in the number and intensity of rain events; increased drought conditions; increased evaporation rates; and, reductions in fresh water sources such as snow packs, lakes, and rivers. As global warming progresses and the global population increases, water demand is likely to rise, which will impact energy demand because the two are intimately connected. Centralized energy production, particularly biofuel and hydropower, are extremely water intensive. On the flip side, moving water is extremely energy intensive due to its weight. Water and energy are also connected through building systems, where tradeoffs between water efficiency and energy efficiency are regularly incorporated into air conditioning, refrigerators, ice machines, and other mechanical and refrigeration equipment. For additional information, please review the U.S. Global Change Research Program’s 2009 Report “Global Climate Change Impacts in the United States” and the Pacific Institute.
Sample Locations
National
U.S. Mayors Climate Protection Agreement: Item 9, “Evaluate opportunities to increase pump efficiency in water and wastewater systems; recover wastewater treatment methane for energy production.” (link)
Austin
Austin Climate Protection Plan 2007: Targets the co-benefits associated with water conservation, energy conservation, and fossil fuel use reduction through actions such as: reducing peak day water use by 1%, instituting landscape irrigation restrictions between 10am and 7pm, offering rebates for water efficient appliances and rainwater harvesting, expanding the municipally-reclaimed water system, and upgrading water efficiency requirements through the plumbing code. (link)
California
California Assembly Bill 32 (CA AB32): Global Warming Solutions Act of 2006 targets reducing statewide GHG emissions to 1990 levels by 2020. Current activities in the Water sector include: encouraging water recycling and increasing water efficiency both by the end user, in landscape irrigation, and in the municipal water system.
New York City
plaNYC 2007: Protect water quality and ensure adequate supply of potable water using the following strategies: protect water sources through the watershed protection program, reduce citywide water consumption by 60 million gallons/day through efficiency measures, and evaluate new water sources such as reusing municipally treated reclaimed water for greywater purposes (e.g., toilet flushing, irrigation, etc.). (link)
Suggested Additional Reading
Intergovernmental Panel on Climate Change Fourth Assessment Report (link)
Kyoto Protocol (link)
U.S. EPA , 2009 U.S. Greenhouse Gas Inventory Report (link)
U.S. Global Change Research Program, “Global Climate Change Impacts in the United States,” 2009 (link)
U.S. Mayors Climate Protection Agreement (link)
Copyright: © Biositu, LLC, and Building Public Health, 2010.
