

Four Examples of Designs that Reduce the Site-Specific Health Risks of Climate Change. Example 4: Disease-Carrying Insects.

Disease-Carrying Insects
Health Impact
As annual temperatures warm and precipitation patterns change as a result of climate change, disease-carrying insects have begun to migrate into areas that may not be prepared for them. Dengue is the most common mosquito-borne virus in the world, resulting in 50 to 100 million infections and 25,000 deaths annually. However, the U.S. had largely escaped dengue outbreaks from the end of World War II to 1980. Since that time, sporadic outbreaks have occurred in the Southern U.S., particularly Texas and Florida. The average cost of treatment in the U.S. is $17,803 per patient. (Source: 3rd National Climate Assessment.)
Context
The primary carrier of the virus, the Aedes aegypti mosquito, is extremely sensitive to changes in temperature, precipitation, and the built environment. While models predict the spread of this mosquito north from Mexico and the Carribean into the contiguous United States, studies show that, historically, a combination of building design and social norms have largely protected Americans from infection when outbreaks occur South of the international border. A study of a Dengue outbreak in 1999 found that the level of dengue present in the population of Laredo, Texas, was 1/2 - 1/10 of the population in Nuevo Laredo, Tamaulipas (just across the border in Mexico). The findings were most closely correlated with the presence of closed windows and air conditioning in Texas buildings, effectively blocking exposure to mosquitoes. Furthermore, buildings on the Mexican side of the border not only lacked central air conditioning but their interiors were also often left open to the elements without protective screens over windows and doors.
Design Strategy
As operable windows, passive cooling, and natural ventilation become more common features of green buildings, care must be taken to protect occupants from health threats that could enter from the outside. Otherwise, as has been noted in a number of multi-family developments already, building occupants are not likely to make use of these energy efficiency features – both to avoid the annoyance of stinging insects and to protect themselves from diseases like dengue.
Relevant LEED v4 Credit(s)
Benefits to Climate Change Mitigation and Adaptation
In this example, the homes and businesses in Mexico were more energy efficient than buildings in the U.S., because they did not use air conditioning. This is an example where energy efficiency (i.e., climate change mitigation) should be balanced with safeguards such as screens that protect building occupants from the health hazards associated with climate change (i.e., climate change adaptation).
Go Back to Drought/Flood Example.
Go Back to Main Post.
Copyright: © Biositu, LLC, and Building Public Health, 2015.
Four Examples of Designs that Reduce the Site-Specific Health Risks of Climate Change. Example 3: Drought/Flood Cycle.

Drought/Flood Cycle
Health Impact
The drought/flood cycle has already shifted in many parts of the U.S. due to climate change. Heavy precipitation events are becoming more common each year, concentrating annual rainfall into a smaller period of time each spring, and washing water downstream that historically would have replenished lakes, rivers, and aquifers. Less precipitation falls throughout the remainder of the year, leading to drought conditions. Drowning is the most direct health effect of flooding, resulting in 98 deaths per year in the U.S. It is of particular concern in areas prone to flash flooding and/or tropical storms. Other health impacts associated with drought and flooding include waterborne illness caused by compromised water quality and respiratory illness due to damp indoor environments (flooding) or exposure to wildfires or dust storms (drought). (Source: 3rd National Climate Assessment.)
Context
Central Texas is known as “Flash Flood Alley,” due to the rapidity and severity of flooding that occurs there, particularly following major droughts. In 2008, I co-authored a vulnerability map of Austin, TX, that identifies the neighborhoods with them most acute combination of social vulnerability (e.g., population density, elderly, socially isolated, and minority populations) and environmental vulnerability (e.g., flood plains and low water crossings).
Design Strategy
In subsequent research, I found that evidence in the public health literature supported applying a number of credits in the U.S. Green Building Council’s Leadership in Energy and Environmental Design (LEED) rating system as protective measures in vulnerable neighborhoods. These green building strategies include:
-
promoting the use of alternative forms of transportation to provide multiple evacuation options during flooding events;
-
increasing native vegetation on-site to maximize stormwater retention and filtration; and,
-
making use of rainwater to irrigate, flush toilets, and even provide potable water during and immediately following flooding events.
Relevant LEED v4 Credit(s)
Site assessment
Sensitive land protection
Access to quality transit
Reduced parking footprint
Site development – protect or restore habitat
Open space
Rainwater management
Heat island reduction
Outdoor water use reduction
Indoor water use reduction
Benefits to Climate Change Mitigation
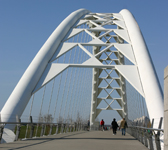
Site shading can reduce a building’s electricity use, one of the major causes of anthropogenic (i.e., human caused) greenhouse gas (GHG) emissions. Alternative forms of transportation reduce the other major source of GHG emissions associated with the built environment – single occupancy car travel.
Benefits to Climate Change Adaptation
Reduce exposure of vulnerable populations to flash flooding. Mitigate exposure through multiple evacuation routes and access to potable water if occupants choose to shelter in place during a flood.
Go Back to Extreme Heat Example. Continue to Disease-Carrying Insects Example.
Go Back to Main Post.
Copyright: © Biositu, LLC, and Building Public Health, 2015.
Four Examples of Designs that Reduce the Site-Specific Health Risks of Climate Change. Example 2: Extreme Heat.

Extreme Heat
Health Impact
The number and intensity of heat waves is increasing in the U.S., resulting in spikes in mortality from heat-related conditions such as heat stroke. Heat waves can also increase the death rate among people with cardiovascular, respiratory, or cerebrovascular disease. (Source: 3rd National Climate Assessment.)
Context
According to the MN Department of Health, in 2001, in spite of an average summer temperature of only 63.8o F, 19 people died in Minnesota of heat-related illness (mostly in the months of July and August). Since that time, as a member of the U.S. CDC’s Climate-Ready States and Cities Initiative grant program, the state has worked on improving prevention and emergency response activities related to extreme heat.
Design Strategy
An HIA facilitated by Biositu, LLC compared the relative vulnerability to heat among three affordable housing designs located in adjacent neighborhoods along the new Central Corridor light rail line between Saint Paul and Minneapolis.
In spite of the projects’ close proximity to each other and similar scope, the recommendations resulting from the HIA varied widely.
-
Recommendations for a mixed-income, mixed-use development in the Hamline-Midway neighborhood: Include a pocket park as part of the development design to mitigate the urban heat island effect. Provide water fountains, misting stations, and interactive water features for children. Install ceiling fans and operable windows with screens to encourage natural ventilation while protecting residents from mosquitoes and other pests. Install an on-site renewable energy installation to provide an uninterruptable power supply in certain common areas in case a heat wave results in a prolonged power outage.
-
Recommendations for a single-family house retrofit in the Frogtown neighborhood: Install landscaping that prioritizes shading the house, deterring mosquitoes, and cultivating edible plants. Focus energy efficiency measures on the roof and attic to reduce solar heat gain during summer months. (Example strategies: light colored or vegetative roof, increased attic insulation, etc.) Install combination storm shutters/screens on doors and windows to encourage use of natural ventilation. Vent the basement to protect for radon contamination and fit it out for use as an in-house cooling center during extreme heat events.
-
Recommendations for a mixed-use, affordable housing development in the Summit-University neighborhood: Install ceiling fans and operable windows with screens to encourage natural ventilation while protecting residents from mosquitoes and other pests. Fit out common areas with air conditioning and designate them as public cooling centers during heat events.
Relevant LEED v4 Credit(s)
Site assessment
Site development - protect or restore habitat
Open space
Heat island reduction
Optimize energy performance
Renewable energy production
Benefits to Climate Change Mitigation
Shading and energy efficiency measures reduce a building’s electricity use, one of the major causes of anthropogenic (i.e., human caused) greenhouse gas emissions.
Benefits to Climate Change Adaptation
Reduce exposure of vulnerable populations (i.e., children and minorities) to extreme heat events. Mitigate exposure through misting stations, water fountains, and cooling centers.
Go Back to Air Pollution Example. Continue to Drought/Flood Example.
Go Back to Main Post.
Photo Credit: Nevit Dilmen
Copyright: © Biositu, LLC, and Building Public Health, 2015.
Four Examples of Designs that Reduce the Site-Specific Health Risks of Climate Change. Example 1: Air Pollution.

Air Pollution
Health Impact
Climate change is projected to increase ground level ozone and/or particulate matter, which can exacerbate respiratory conditions like asthma. (Source: 3rd National Climate Assessment.)
Context
The site selected for the Jack London Gateway Senior Housing project in West Oakland, CA, suffers from poor outdoor air quality due to its proximity to several freeways and the Port of Oakland. Elderly are more vulnerable to the negative health effects of air pollution than the general population. A Health Impact Assessment (HIA) performed by Human Impact Partners recommended identifying sources of air pollution by measuring current levels of particulate matter at several locations on the site and researching the Port’s plans for expansion.
Design Strategy
The entrance of the 55-unit complex was located inside a courtyard oriented away from the freeways and Port and towards the existing neighborhood. Balconies facing the freeway were converted into bay windows. And, air filters were installed in all residential units and common spaces.
Relevant LEED v4 Credit(s)
Site assessment
Minimum indoor air quality performance
Enhanced indoor air quality strategies
Benefits to Climate Change Mitigation
Integrating the complex into the existing neighborhood encourages alternative forms of transportation, which reduces single vehicle car use.
Benefits to Climate Change Adaptation
Reduce exposure of a vulnerable population (the elderly) to air pollution.
Continue to Extreme Heat Example.
Go Back to Main Post.
Copyright: © Biositu, LLC, and Building Public Health, 2015.
Four Examples of Designs that Reduce the Site-Specific Health Risks of Climate Change

The health effects of climate change have been in the news this summer.
Over the course of three weeks:
-
Pope Francis released the first-ever encyclical letter calling for immediate and sustained action to mitigate climate change and protect the most vulnerable from exposure to climatic events.
-
The prestigious Lancet Commission on Health and Climate Change released its 2015 report, which couches climate change as the most significant community health opportunity of our generation.
-
And, the White House hosted a summit, which resulted in the release of eight actions to protect communities from the health effects of climate change.
Green building design can help protect occupants from the negative health effects of climate change. However, the level of risk shifts from location to location in response to changes in the environmental, demographic, and community health context.
Click on the links below to read about four examples of the role design can play in protecting building occupants from the contextual health risks of climate change.
Note: The health impact statements in each example have been paraphrased from the Human Health section in the 3rd National Climate Assessment.
Are you interested in learning about how this type of assessment can benefit your design project or existing facility? Contact us at This email address is being protected from spambots. You need JavaScript enabled to view it. for additional information about our services and a free initial consultation.
Copyright: © Biositu, LLC, and Building Public Health, 2015.
Transportation Trends Toward Health
 A slow and quiet transformation appears to have begun in the U.S. around the daily commute. According to recent publications, both in scientific journals and the mainstream media, commuters have begun to see a gap between the range of transportation options available to them and their underlying preferences.
What Commuters Want
-
More transportation options – The Department of Transportation’s Bureau of Transportation Statistics recently released the results of a 2009 survey that asked 1,000 households to rank the importance of certain transportation infrastructures. Major roads/highways came in at first place (>90%). However, over 70% of respondents also supported sidewalks, local transit, and pedestrian friendly livability characteristics. While airport access and adequate parking also ranked highly (>80%), this survey may point to a trend away from a desire for an automobile-centered lifestyle.
-
A shorter commute – 78% of respondents to the National Association of Realtors’ 2011 Community Preference Survey indicated that they would prioritize living within a thirty minute commute to work. And, 59% would trade a smaller house and lot if it reduced their commute time.
-
A mixed-use, pedestrian-friendly neighborhood – The Community Preference Survey also found that 66% of respondents would prioritize living in an area within easy walking distance of amenities such as grocery stores, pharmacies, restaurants, and hospitals.
Cars: Asset or Inconvenience?
Given the preferences listed above, the question arises, is the single-occupancy vehicle becoming outmoded?
-
Decline in car use – A recent article by Anita Elash in The Globe and Mail points to a trend of reduced car use in all industrialized countries (including the U.S., where, after decades of increasing vehicle miles traveled each year, car usage per capita has dropped to 1998 levels). She writes, “the shift is so gradual and widespread that it's clearly not a product of any ‘war on the car’ or other ideological campaign. Rather, it's a byproduct of a stage of development that cities were probably destined to reach ever since the dawn of the automobile age: Finding themselves caught in an uncomfortable tangle of urban sprawl, population growth and plain individual inconvenience, people, one by one, are just quietly opting out.”
-
The “peak car” generation – This term, cited in publications such as Scientific American and The Independent, points to a demographic shift in industrialized countries. It appears that younger generations may not share their parents’ and grandparents’ fascination with cars. Other articles such as Krissy Clark’s post “Blame My Driving Habits on that Parking Spot” on the Climate Watch blog speak of the balance shifting away from the flexibility afforded by car use and towards the cost and inconvenience of finding parking spots once you reach your destination.
What Does This Mean for Our Health?
Pros
The benefits of alternative (or active) transportation have been extensively studied. In particular, the increase in levels of physical activity resulting from taking the bus, walking, or riding a bike rather than driving can have a myriad of beneficial health effects.
-
Obesity – Engaging in regular physical activity can reduce obesity. Walking to and from the bus or subway as part of the work commute often meets the recommendations of the 2008 Physical Activity Guidelines for Americans: 2.5 hours of moderate physical activity per week. The Active Living Research Literature Database (funded by the Robert Wood Johnson Foundation) offers an extensive review of the literature linking physical activity and obesity.
-
Diabetes & Heart Disease – The onset of Type 2 Diabetes and heart disease can be slowed or prevented through a combination of physical exercise and nutrition (Blair & Morris, 2009).
-
Mental Health – Using alternative forms of transportation enhances mental health both by removing the stress of driving on congested roads and by increasing physical activity (Taylor & Dorn, 2006). It also can provide mental health benefits by increasing commuters’ daily dose of green spaces (Sick Nielsen & Bruun Hansen, 2007).
Cons
In spite of its many health benefits, alternative transportation can also lead to negative health outcomes, if the built environment is not designed to accommodate it.
-
Injury – According to the U.S. Centers for Disease Control and Prevention, injury (including pedestrian-motor vehicle collisions) is the leading cause of death in the U.S. among persons 1-44 years. However, in many cases, these injuries are preventable through modifications to the built environment (Retting et al., 2003).
-
Respiratory & Cardiovascular Disease – The six criteria air pollutants regulated by the U.S. EPA (carbon monoxide, sulfur oxides, nitrogen oxides, ozone, lead, and particulate matter) can cause both short-term, acute respiratory and/or cardiovascular effects and exacerbate chronic diseases, such as asthma. While the long-term effect of encouraging alternative transportation is likely to be a reduction in street-level air pollution (Frank et al., 2006), the short-term effect may be increased exposure (Carlisle and Sharp, 2001), because physical activity can lead to faster, deeper breathing and inhalation through the mouth rather than the nose, which filters out many pollutants before they can reach the lungs.
Removing Barriers
With the trend moving away from the car and towards a more varied approach to transportation choices, it is becoming clear that, in many communities in the U.S., the built environment actively prevents widespread use of alternative transportation. These obstacles may take the form of physical barriers (i.e., the absence of bike trails and sidewalks) or mental barriers (i.e., the assumption that driving equates to independence). In an extreme example, the MoveArkansas blog describes a crosswalk at a popular intersection in Little Rock, Arkansas, that actually bans pedestrians from 6am to 6pm, Monday through Friday.
In spite of the these challenges, a number of innovative programs across the country are trying out new ways to modify the built environment that both remove barriers to alternative transportation and reduce potential negative health effects:
-
Offer seniors an alternative to the car – Elderly populations represent the highest fatality rates in the U.S. for pedestrian-motor vehicle collisions (Beck, Dellinger, & O'Neil, 2007). Recognizing the severity of this problem, programs such as the U.S. EPA’s National Agenda for the Environment and the Aging have begun to promote community development plans that integrate the elderly into smart growth developments through applicable housing options and opportunities for civic engagement.
-
Safety through numbers – New York City has taken the position that increasing the number of cyclists on the road is the most effective way to protect them from collisions with motor vehicles. As a result, when it launches its bike share program in 2012, the City will not require adult bike share riders to wear helmets, which are seen as a deterrent to ridership.
-
Wildlife crossings – High injury rates among another vulnerable population, wildlife, have led to the development of the emerging field of road ecology, which integrates wildlife crossings into transportation infrastructure design.
-
Improve localized air quality – Akbari et al. (2001) found that policies aimed at mitigating the urban heat island effect through light-colored roofs, streets, and sidewalks, as well as increasing vegetation through tree planting and vegetative roofs could reduce the number of ozone action days, in addition to saving $10B per year nationwide in reduced air conditioning use.
As seen above, projects aimed at removing barriers to alternative transportation can benefit from developing a deep understanding of their environmental and health context. Health Impact Assessments offer recommendations that allow design solutions both to be tailored to the specific needs of the population they serve and to avoid unintentional exposure to harm. Visit our blog post, “Health Impact Assessments: A Design Tool?,” for additional information about the role Health Impact Assessments can play in the design process.
References
Active living research literature database. Robert Wood Johnson Foundation. (link)
Akbari, H, Pomerantz, M, Taha, H. (2001). Cool surfaces and shade trees to reduce energy use and improve air quality in urban areas. Solar Energy, 70(3), 295-310. (link)
Beck, Laurie, Dellinger, Ann, O’Neil, Mary. (2007). Motor vehicle crash injury rates by mode of travel, United States: Using exposure-based methods to quantify differences. American Journal of Epidemiology, 166(2), 212-218. (link)
Belden Russonello & Stewart. (2011, March). The 2011 community preference survey: What Americans are looking for when deciding where to live. (link)
Blair, Steven, Morris, Jeremy. Healthy hearts—and the universal benefits of being physically active: Physical activity and health. (2009). Annals of Epidemiology, 19(4), 253-256. (link)
Carlisle, A. J., Sharp, N. C. C. Exercise and outdoor ambient air pollution. (2001). British Journal of Sports Medicine, 35, 214-222. (link)
Clark, Krissy. Blame my driving habits on that parking spot. (2011, September 29). Climate Watch. (link)
Elash, Anita. Are we reaching “peak car”? (2011, October 22). The Globe and Mail. (link)
Farrell, Sean Patrick. A gentle push for bikers, not a shove. (2011, October 14). The New York Times. (link)
Frank, Lawrence, Sallis, James, Conway, Terry, Chapman, James, Saelens, Brian, Bachman, William. Many pathways from land use to health: Associations between neighborhood walkability and active transportation, body mass index, and air quality. (2006). Journal of the American Planning Association, 72(1), 75-87. (link)
Guarino, Jenny, Pheny Weidman. Public perceptions on transportation characteristics of livable communities: The 2009 omnibus household survey. (2011, July). U.S. Department of Transportation Research and Innovative Technology Administration Special Report. (link)
McKuin, Tim. A city for cars or for people? (2011, October 4). MoveArkansas. (link)
Sick Nielsen, Thomas, Bruun Hansen, Karsten. Do green areas affect health? Results from a Danish survey on the use of green areas and health indicators. (2007). Health & Place, 13(4), 839-850. (link)
Taylor, Adrian, Dorn, Lisa. Stress, fatigue, health, and risk of road traffic accidents among professional drivers: The contribution of physical inactivity. (2006). Annual Reviews of Public Health 2006, 27, 2.1-2.21. (link)
Tepper, Laura. Road ecology: Wildlife habitat and highway design. (2011, September 22). Design Observer. (link)
Retting, Richard, Ferguson, Susan, McCartt, Anne. A review of evidence-based traffic engineering measures designed to reduce pedestrian-motor vehicle crashes. (2003). American Journal of Public Health, 93(9), 1456-1463. (link)
U.S. Centers for Disease Control and Prevention. The burden of injury and violence: A pressing public health concern. (link)
U.S. Department of Health & Human Services. 2008 Physical activity guidelines for Americans. (link)
U.S. Environmental Protection Agency. Effects of air pollutants: Health effects. (link)
U.S. Environmental Protection Agency. National agenda for the environment and the aging. (link)
Voorhees, Josh. Has the U.S. reached peak vehicles? (2012, January 6). Scientific American. (link)
Witchalls, Clint. Is this the end of the car? (2011, May 20). The Independent. (link)
Copyright: © Biositu, LLC, and Building Public Health, 2011.
Infrastructure Strategy: Mixed-Use Suburban Neighborhood Development, Eastern Temperate Forest Ecoregion
Visit the Overview blog post for an introduction to the Building Public Health Blog Library of Strategies.
Visit the Reference section below for the primary source of data incorporated into this blog post.
Context
The context for this proposed design strategy is a mixed-use suburban neighborhood development outside a north-central Connecticut town with roughly 30,000 residents and a median household income close to the 2009 national average of $50,221. The town’s dense, historic center is surrounded by low-density suburban residential neighborhoods that are serviced by shopping centers and big box retail stores located on major thoroughfares. A commercial and light industrial corridor was developed along 3-5 miles of a major roadway in the 1980’s. These businesses employ some local residents; however, many of their employees drive in from other suburbs, and many of the town residents commute to other towns and suburbs to work.
How Resilient Is The Surrounding Infrastructure?
Roads & Transit
-
Multiple transportation routes are available to and from the area, including the major North/South freeway that cuts through the state (Interstate 91), the Northeast Regional Amtrak rail with a nearby stop, CT Transit regional bus lines, and the planned New Haven/Hartford/Springfield commuter rail project.
-
Furthermore, bike lanes and trails, while incomplete, are readily available and increasingly developed in the area.
-
A regional airport is also located nearby.
Benefits & Risks – The site’s context is typical of many suburban areas in the U.S. in that it is extremely well connected to roads, but the transportation scale prioritizes cars over other forms of transportation. The level of density both in the site’s region and between the site and major employment hubs, however, merits the use of commuter rail and bike paths to a larger extent than suburbs in less densely populated regions.
Water Source and Distribution
-
Source – The development falls within the jurisdiction of The Metropolitan District (MDC), a non-profit municipal corporation established in 1929 that supplies potable water, wastewater, and stormwater services for Hartford and seven surrounding municipalities. The raw water is sourced from surface water in Connecticut and Massachusetts, most of which flows from watersheds that are owned and protected by the MDC into two large reservoirs about 20 miles from the site.
-
Quality – The MDC treats the water introduced into the potable water system using sand filtration, chlorination, fluoridation, pH adjustment, and corrosion control. An on-site laboratory tests for physical, chemical, and bacteriological contaminants in three locations: the reservoirs, the treatment plants, and designated sampling sites throughout the service area. The 2010 Water Quality Report indicates overall high water quality; however, three of 52 sites tested for lead were found to be above the maximum allowable concentration level of 15 ppb. Back flow prevention (i.e., cross-connection control devices) are required on sites using alternative water sources (such as rainwater collection) and for process water uses, such as irrigation, solar hot water systems, and geothermal wells.
-
Quantity – The MDC website and 2010 Water Quality Report offer water efficiency tips and encourage water conservation generally. However, other than a reported increase in residential irrigation, which may strain water supplies in the future, the services area appears not to suffer at the present from water scarcity.
Benefits & Risks – >The public water system provides access to high quality water; however, two-thirds of its water is treated using a system built in 1929. Furthermore, the distribution and sewer infrastructure was developed in the 1850’s. The system therefore suffers from the vulnerability common to all centralized utilities. The regulations designed to prevent cross-contamination to the public water supply may discourage or not allow installation of certain on-site water collection, treatment, and storage systems, further increasing the region’s vulnerability to loss or widespread contamination of its water supply if the historic water treatment facility is compromised.
Wastewater
-
The public wastewater collection system is also managed by MDC. A main treatment facility and three satellite facilities provide both primary and secondary treatment of effluent from sewers in the service area. All sludge is processed in the main facility in Hartford. Three of these facilities were awarded Gold Peak Performance Awards by the National Association of Clean Water Agencies to recognize 100% compliance with their national pollutant discharge elimination system permit in 2010.
-
The public water and wastewater system was initially developed in the 1850’s and suffers from both combined sewer overflows (CSOs) and sanitary sewer overflows (SSOs). The MDC has launched a program called The Clean Water Project with the goals of reducing the number of CSOs, eliminating SSOs, and reducing the levels of nitrogen entering water bodies by 2020. According to the MDC, the sewer separation project will coincide with other infrastructure upgrades such as utility upgrades and street resurfacing.
Benefits & Risks – The public wastewater system provides a high level of wastewater treatment at a low level of individual effort; however, according to the MDC, CSOs and SSOs lead to more than 50 instances a year of untreated sewage entering the Connecticut River. Also, as part of the region’s centralized water/wastewater system, it is vulnerable to the same concerns raised above in the Water section.
Electricity
-
Connecticut has deregulated its electrical power sector. It is therefore possible for property owners to choose which power company to contract with, including companies that offer renewable energy options. The CT Clean Energy Options Program assists consumers in supporting renewable power by purchasing it through their electric service provider. The Connecticut Clean Energy Fund has established a Clean Energy Communities program that rewards communities that have increased the percentage of renewable power purchased both by the municipal government and by utility customers.
-
The state of Connecticut has instituted a number of policies and programs to incentivize distributed renewable power installations and electric vehicles. For example, the Clean Energy Incentives Program and the Connecticut Energy Efficiency Fund offer rebates and other incentives to residential and commercial/institutional projects that install solar PVs, solar thermal systems, geothermal and heat pump systems, and even small wind generation systems. The Electric Vehicles (EV) Infrastructure Council is charged with overseeing the development of an infrastructure to support EVs and incentivizing their purchase by residents. The Customer-Side Distributed Generation Program offers low interest loans to electric generation and/or conservation projects ≥ 50 kW. It also awards valuable renewable energy credits to applicable generation projects.
Benefits & Risks – Currently, most of the state of Connecticut relies on the centralized electric grid for all of their electric power. However, the state is actively incentivizing the installation of distributed energy generation, particularly from renewable sources. The size of a typical mixed-use suburban neighborhood development would increase the array of electric generation options open to it, some of which could be specific to a building site while others might service the entire development.
Climate Change Impacts
The Adaptation Subcommittee to the Governor of Connecticut’s Steering Committee on Climate Change used downscaled climate models developed by the New York Panel on Climate Change to identify the following climatic changes in the 21st century:
-
Temperature – Annual average temperatures in Connecticut are projected to rise from 4-7.5 °F. The frequency, duration, and intensity of heat waves may also increase, while extreme cold events may reduce in frequency.
-
Precipitation – The total amount of precipitation may increase by 5-10%; however, it is projected to fall more often in the form of severe rain events, causing flooding.On the other end of the spectrum, droughts are also expected to increase in frequency, duration, and intensity.
-
Sea Level Rise – Sea levels are projected to rise by 12-23 inches, causing the coastal areas to be more vulnerable to flooding threats associated with extreme storm events. Under the “Rapid Ice-Melt Sea Level Rise” scenario, the sea level may increase by 41-55 inches.
Based on these projections, the subcommittee predicted that the following types of infrastructure will be negatively impacted by climate change:
-
Coastal flood control and protection
-
Dams and levees
-
Stormwater infrastructure
-
Transportation infrastructure (including airports, water ports, railroads, and roadways)
-
Facilities and buildings (including telecommunication, electric generation, interstate gas pipelines, and solid waste management, in addition to vital buildings such as hospitals and fire stations)
Imagine You Were Designing a Mixed-Use Suburban Neighborhood Development in this Community…
Based on the information listed above regarding the current condition of the community and regional infrastructure and its likely future as the climate continues to change, you might consider starting the design process by asking questions such as:
-
Why do the majority of employees along the commercial corridor adjacent to the site choose to commute 30 minutes to work everyday? What amenities are available in their neighborhoods that are not present in the neighborhood surrounding the site? How might you entice them to live closer to work?
-
What are the gaps in the current transportation network that prevent the employees in adjacent businesses from using a combination of public transit and active transportation (i.e., walking and cycling) to commute to and from work? What are the transportation barriers for area residents?
-
How vulnerable is the site to disruption in water supply, electricity, telecommunications, solid waste pick up, and other utilities during an extreme weather event? Are there opportunities to reduce or offset this vulnerability by providing some of these services on-site?
-
Which on-site utilities (such as water collection, energy generation, composting, etc.) should be considered for the entire neighborhood development? Which should be encouraged for specific building projects?
-
What incentives and variances are available through state and local funding sources to help offset the cost of installing energy- and water-efficiency measures, on-site renewable energy generation, etc.?
-
Could the project register as a pilot program for new and innovative technologies that are being developed by companies headquartered in Connecticut? How might this type of program enhance the project's appeal to area landowners, businesses, and future tenants/homeowners?
The answer to these questions might result in solutions similar to the following list of design recommendations, which have been organized to highlight their relevance to building codes, green building programs, and greenhouse gas emissions reduction programs.
|
Design Recommendations |
Relevance to… |
|
|
|
|
Building/Planning Codes |
Green Building Programs |
GHG Emissions Programs |
|
1. Provide a range of housing types (multi-family, single family attached, single family detached); sizes (studio, 1-bedroom, multiple bedrooms); and, costs. Focus on the housing types favored by employees of nearby businesses who currently commute long distances to work. |
Building code may require certain densities, number of parking spaces, etc., that limit the variety of housing options in the area. |
LEED for Neighborhood Development encourages this approach. |
Enticing employees of nearby businesses to live close to work can help the township achieve status as a CT Clean Energy Community. |
|
2. Design the development to fill in transportation gaps wherever possible. For example, install bike paths and sidewalks. Work with the regional bus system to connect the site to the commuter rail station, the historic downtown area, and regional shopping centers. |
This strategy may help support a request for a variance to reduce the minimum number of parking spots required for the development. |
Alternative transportation. |
Reduces emissions by reducing the number of trips made in single-occupancy vehicles. |
|
3. Design the site landscaping to retain, filter, and reuse stormwater on-site to reduce erosion, the risk of flooding, and compromising river water quality. |
Coordinate with the MDC’s Clean Water Project. (add link) |
Erosion control. Stormwater mitigation. Water efficient landscaping. |
Reduces emissions by reducing the volume of water processed by the wastewater treatment plant. |
|
4. Maximize the efficiency of water fixtures and eliminate potable water use for landscape irrigation. |
Rebates and incentives may be available to help finance some new technologies. |
Water use reduction. Water efficient landscaping. |
Reduces emissions by reducing demand on the public water system. |
|
5. Pilot test distributed wastewater technologies to reduce demand on the central wastewater system. |
Codes will govern the level of treatment required and the type of usage allowed. Coordinate with the MDC’s Clean Water Project. (add link) |
Wastewater use reduction. |
Reduces emissions by reducing demand on the public wastewater system. |
|
6. Investigate options for on-site rainwater collection, filtering, storage, and reuse. |
Codes will govern the level of treatment required and the type of usage allowed. Health and safety codes may not allow rainwater inside buildings. |
Erosion control. Stormwater mitigation. Water efficient landscaping. Water use reduction. |
Reduces emissions by reducing demand for potable water and reducing the volume of water processed by the wastewater treatment plant. |
|
7. Work with the local public health agency to test the filtration level of onsite water collection and wastewater treatment so that the development is authorized to use it as drinking water. |
Codes will govern the level of treatment required and the type of usage allowed. |
Stormwater mitigation. Water efficient landscaping. Water use reduction. Wastewater use reduction. |
Reduces emissions by reducing demand for potable water and reducing the volume of water processed by the wastewater treatment plant. |
|
8. Investigate options for on-site renewable energy sources. |
Incentives may be available to help fund on-site renewable energy installations and pilot projects. |
On-site renewable energy. |
Reduces emissions by replacing demand for conventional electricity sources with emissions-free energy. |
|
9. Investigate options for an on-site composting program and community garden. |
Codes will govern composting activities. |
Waste reduction. Water efficient landscaping. Water use reduction. |
Reduces emissions by reducing food miles traveled and the energy associated with transporting solid waste. |
|
10. Require all residential buildings in the development to be designed as net-zero energy homes and all commercial buildings to be designed to support passive survivability during an extreme weather event. |
Incentives may be available to help fund energy efficiency, water efficiency, and on-site renewable energy strategies. |
Energy optimization. Water use reduction. On-site renewable energy. |
Reduces emissions by reducing demand on the central energy and water systems and by replacing demand for conventional electricity sources with emissions-free energy. |
References
Adaptation Subcommittee to the Governor’s Steering Committee on Climate Change (April 2010), The Impacts of Climate Change on Connecticut Agriculture, Infrastructure, Natural Resources and Public Health (link)
Connecticut Clean Energy Fund (link)
Connecticut Clean Energy Incentives Program (link)
Connecticut Customer-Side Distributed Generation Program (link)
Connecticut Energy Efficiency Fund (link)
Connecticut Electric Vehicles (EV) Infrastructure Council (link)
CT Clean Energy Options Program, available at: (link)
CT Transit (link)
The Metropolitan District (MDC) (link)
New Haven/Hartford/Springfield commuter rail project (link)
U.S. Census (link)
U.S. EPA Level I Ecoregions (link)
Are you interested in learning about how this type of assessment can benefit your design project or existing facility? Contact us at This email address is being protected from spambots. You need JavaScript enabled to view it. for additional information about our services and a free initial consultation.
Copyright: © Biositu, LLC, and Building Public Health, 2011.
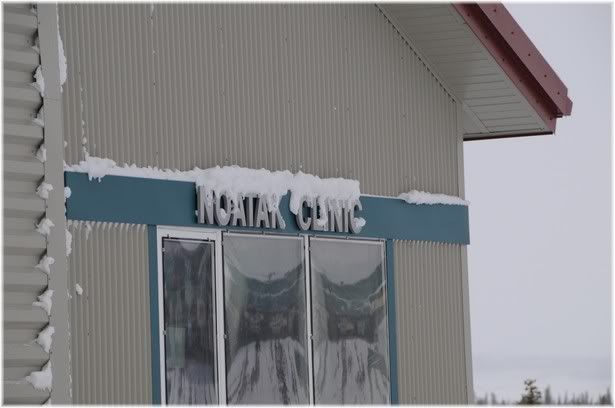
Infrastructure Strategy: Rural Health Clinic, Tundra/Taiga Ecoregion
Photo Credit: Aqvaluq Photography
Visit the Overview blog post for an introduction to the Building Public Health Blog Library of Strategies.
Visit the Reference section below for the primary source of data incorporated into this blog post.
Context
The context for this proposed design strategy is a remote community in Northeast Alaska with a population of roughly 500 residents from the Inupiat tribe. The economy relies mainly on subsistence activities (i.e., hunting, gathering, and fishing). The modern community was founded in 1939 as part of the Indian Reorganization Act; however, residents relocate to temporary camps closer to the coast during the summer months.
How Resilient Is The Surrounding Infrastructure?
Roads & Transit
-
Transportation routes to and from the community rely on water: ice in the winter and river navigation in the summer. Both routes are being disrupted via shorter sea and river ice in the winter and low water levels in the summer.
-
Barge service is not possible due to low water levels.
-
Airplane cargo transport is expensive.
Benefits & Risks – The relative remoteness of the village enables residents to pursue a subsistence economy with minimal encroachment from other economic activities. However, dependence on a seasonal transportation infrastructure risks an increasing number of disruptions as the climate warms, possibly leading to rising prices and shortages in fuel, food, and other supplies.
Permafrost
-
Critical infrastructure has become vulnerable to subsidence and erosion as the permafrost melts unevenly.
Benefits & Risks – Construction techniques can attempt to minimize the likelihood of further permafrost melt; however, they cannot reverse the overall trend.
Water Source and Distribution
-
Source – The community sources water from three shallow wells located in the Noatak River. Low water levels have led to occasional seasonal water shortages.
-
Quality – Water quality has been compromised in two ways: through increased turbidity in the river caused by erosion from heavy precipitation events and through the introduction of landfill waste in the river caused by bank erosion. Increasing levels of giardia lamblia and cryptosporidium have been detected at the water treatment plant, increasing water filtration costs to an unsustainable level. Traditional water sources also can be contaminated with pathogens such as giardia lamblia.
-
Quantity – The community water treatment plant was constructed in 1995 with storage designed to service a population of 486 for 3 days; however, the population connected to the water supply currently exceeds 500. Roughly 70% of homes are connected to the public water system. The rest continue to haul water and use honey buckets to treat waste.
-
Structural Integrity – The community water treatment plant was constructed with a reinforced concrete slab foundation on an insulated gravel pad and ten thermosyphons that remove heat from the ground to prevent the permafrost from thawing. In spite of these measures, the permafrost has thawed to a depth of 5-10 feet, compromising the foundation. Contributing factors: warm pipelines, drifting snow, rainwater runoff, solar heat gain. Breaks in the water main have averaged >1 per year over the past decade and are increasing. Breakages are attributed to thawing permafrost and appear to coincide with increasing air temperature.
Benefits & Risks – The public water system provides access to high quality water; however, the treatment plant is over capacity, is extremely energy-intensive, and suffers from increasing vulnerability to structural failures due to melting permafrost.
Wastewater
-
The public wastewater collection system was constructed in 1992 to service the sites connected to the public domestic water system and includes a 7,500 linear foot sewer main, arctic pipe cleanouts, and a system of manholes.
-
Septic tanks perform primary treatment, and the resulting effluent is discharged to a 50,000-gallon lagoon before flowing down into a 3-acre tundra pond for secondary treatment. Waste sludge is deposited in the community landfill.
-
Similar to the potable water system, the public wastewater system suffers from sagging sewer pipes and settling manholes.
Benefits & Risks – The public wastewater system provides a higher level of wastewater treatment at a lower level of individual effort than the traditional honey bucket system; however, similar to the potable water system, it is extremely energy-intensive, and suffers from increasing vulnerability to structural failures due to melting permafrost.
Stormwater Mitigation
-
Thawing permafrost and increased severity of precipitation events are causing flooding damage to fragile riverbanks and coastlines.
Benefits & Risks – Risks associated with increased stormwater include injury, compromised water quality, risk of mold growth in flooded structures, and reduced subsistence food supplies.
Imagine You Were Designing a Replacement Health Clinic in this Community…
Based on the information listed above regarding the current condition of the community water infrastructure and its likely future as the climate continues to change, you might consider starting the design process by asking questions such as:
-
Considering its structural problems and capacity constraints, should we connect to the central water & wastewater system at all?
-
What alternatives exist for water collection, treatment, and storage?
-
How can we conserve water?
-
What type of water efficient fixtures function in this area? Can we obtain them?
-
Can we treat and store water on-site to multiple levels of purity based on the use it will be put to?
-
What is the best way to design a foundation that may sit on permafrost today but will likely need to transition to a floating foundation in a few years?
-
How will that transition affect the water and sewer pipes? Do they need to be located above ground instead of below ground?
-
What can we learn from the way water is conveyed, treated, and disposed at the community’s seasonal subsistence camps that will help the permanent community become more resilient to climatic changes?
The answer to these questions might result in solutions similar to the following list of design recommendations, which have been organized to highlight their relevance to building codes, green building programs, and greenhouse gas emissions reduction programs.
|
Design Recommendations |
Relevance to… |
|
|
|
|
Building/Planning Codes |
Green Building Programs |
GHG Emissions Programs |
|
1. Design the site landscaping to retain, filter, and reuse stormwater on-site to reduce erosion, the risk of flooding, and compromising river water quality. |
Codes will govern the level of treatment required and the type of usage allowed. |
Erosion control. Stormwater mitigation. Water efficient landscaping. |
Reduces emissions by reducing the volume of water processed by the wastewater treatment plant.
|
|
2. Maximize the efficiency of water fixtures. Investigate whether a hybrid technology between traditional flush toilets and honey buckets might be implemented successfully on-site. |
Health and plumbing codes guidelines may restrict efficiency technologies in certain areas of the clinic.
|
Water use reduction. |
Reduces emissions by reducing demand on the public water system. |
|
3. Design underground water pipes with flexible connections to minimize the likelihood of breakages in the event of uneven settlement due to melting permafrost. |
Building codes in regions with floating foundations may provide guidance on best practice technologies.
|
Increasing longevity of building structures and water infrastructure. |
Reduces emissions by reducing waste in the public water system caused by leaks. |
|
4. Install foundation monitors and built-in leveling devices to facilitate conversion to a floating system when the permafrost melts. |
Building codes in regions with floating foundations may provide guidance on best practice technologies.
|
Increasing longevity of building structures and water infrastructure. |
Reduces emissions by reducing the need to retrofit and/or rebuild foundations and infrastructure. |
|
5. Pilot test distributed wastewater technologies to reduce demand on the central wastewater system. |
Codes will govern the level of treatment required and the type of usage allowed.
|
Wastewater use reduction. |
Reduces emissions by reducing demand on the public wastewater system. |
|
6. Investigate options for on-site rainwater and snow storage, including whether the health clinic should manage its water supply and wastewater autonomously or whether an on-site water and wastewater system might service the surrounding neighborhood. |
Codes will govern the level of treatment required and the type of usage allowed. |
Erosion control. Stormwater mitigation. Water efficient landscaping. Water use reduction. |
Reduces emissions by reducing demand for potable water and reducing the volume of water processed by the wastewater treatment plant.
|
|
7. Work with the local public health agency to test the filtration level of onsite water collection and wastewater treatment so that the development is authorized to use it as drinking water. |
Codes will govern the level of treatment required and the type of usage allowed. |
Stormwater mitigation. Water efficient landscaping. Water use reduction. Wastewater use reduction. |
Reduces emissions by reducing demand for potable water and reducing the volume of water processed by the wastewater treatment plant.
|
|
8. Investigate options for on-site renewable energy sources that could power an on-site water and/or wastewater system. |
Incentives may be available to help fund on-site renewable energy installations. |
On-site renewable energy. Stormwater mitigation. Water efficient landscaping. Water use reduction. |
Reduces emissions by reducing energy demand, reducing potable water demand, and reducing the volume of water processed by the wastewater treatment plant. |
Reference
Climate Change in Noatak, Alaska: Strategies for Community Health. (2011) Alaska Native Tribal Health Consortium Center for Climate and Health. Available at: http://www.anthc.org/chs/ces/climate/upload/Climate_Change_in_Noatak_Strategies_for_Community_Health.pdf
U.S. EPA Level I Ecoregion Website. Available at: http://www.epa.gov/wed/pages/ecoregions/na_eco.htm
Image Credit: (C) Aqvaluq Photography.
Image available at: http://i149.photobucket.com/albums/s63/tundratantrum/noataktrip8.jpg
Tundratantrum blog, Keeping it Real at 66 Degrees North Latitude.
Are you interested in learning about how this type of assessment can benefit your design project or existing facility? Contact us at This email address is being protected from spambots. You need JavaScript enabled to view it. for additional information about our services and a free initial consultation.
Copyright: © Biositu, LLC, and Building Public Health, 2011.
Next Generation of Sustainable Water Solutions - Resources and Presentation Synopsis
 Adele Houghton's presentation at the inaugural SXSW Eco conference this week, "John Snow’s Legacy: the Next Generation of Sustainable Water Solutions," proposed a new model for water management that capitalizes on collaboration between public health regulators, climate change policy makers, and green building practitioners.
The talk, which reviewed the link between water and public health and the impact that climate change is likely to have on global water resources, concentrated on innovative approaches to managing water supplies sustainably while continuing to protect the public from exposure to the waterborne pathogens that were major killers as recently as 1900.
This blog post offers a brief synopsis of the talk as well as links to reference information and useful resources.
Introduction
The origins of modern day public health lie in sanitation, most famously exemplified by Dr. John Snow’s observation that Cholera outbreaks in mid-nineteenth century London appeared to be associated with contaminated water sources. Since that time, many innovations in building and infrastructure technology have been driven by health concerns. Today, however, public health regulations are often regarded as impediments to innovation rather than as useful safeguards of the public’s health. Building on public health’s evidence-based approach to managing water resources, this presentation will introduce a new, collaborative model for developing innovative solutions to one of sustainability’s most pressing challenges.
Water and Public Health
From 1900 to 2000, the leading causes of death in the US changed from infectious diseases to chronic, non-communicable diseases. In 1900, the top three causes of death were infectious disease, two of which include water as a pathway. By 1998, the first infectious disease on the list, pneumonia, has dropped to number 6. Regulations improving water quality and sanitation practices greatly contributed to the reduction in mortality associated with infectious disease.
Resources
CDC, Leading Causes of Death, 1900-1998.
CDC, Top 5 Causes of Drinking Water Outbreaks in the US from 1971-2006.
Water and Climate Change
Climate predictions indicate that we are headed towards a world where both energy and water will become more scarce and where natural disasters that threaten the ability of our sanitary systems to function will become more frequent and more severe.
Resources
Bernstein et al. (2007). Climate Change 2007: Synthesis Report, An Assessment of the Intergovernmental Panel on Climate Change.
Global Climate Change Impacts in the United States: A State of Knowledge Report from the U.S. Global Change Research Program (2009).
Greer, et. al. (2008). Climate change and infectious diseases in North America: the road ahead. CMAJ. 178(6):715-22.
Robert Wilkinson, Analysis of the Energy Intensity of Water Supplies for West Basin Municipal Water District (2007).
Sandia National Laboratories, Energy-Water Nexus Web Page.
A New Approach to Sustainable Water Solutions
COMMUNITY SCALE: North Texas Municipal Water District East Fork Wetland Project
The North Texas Municipal Water District East Fork Wetland Project demonstrates how in direct potable water reuse technologies can be instituted successfully. The project diverts 91 million gallons per day of water from the east fork of the Trinity River to flow through a 1,840 acre constructed wetland, using aquatic plants to remove harmful contaminants. The purified water is then pumped 43 miles to Lake Lavon, where it is treated to potable water standards along with other raw water sources and delivered to customers in the Dallas-Fort Worth metro area.
This kind of project, which integrates environmental and climate change benefits into the existing water purification infrastructure, is a perfect candidate for collaboration with local public health officials. Psychologists have found that scientific evidence is not sufficient to convince people that something that triggers revulsion (such as drinking purified human sewage, or, as opponents like to call it, toilet to tap) is actually safe. However, introducing a few intermediate steps that separate the source of perceived contamination (the toilet) from the end product (the tap), can drastically increase acceptance of a technology or practice that previously had be viewed as unacceptable. (Dingfelder, 2004)
The role of public health in this setting is, first, to test and monitor the system to ensure that the wetlands are purifying the water to the intended level. Second, they should be incorporated into the facility’s communications and education strategy. A wetland that purifies effluent can be used as the basis for educating the public about where their water comes from, what types of tests are performed to verify its safety, and the complex relationship between the city’s drinking water system and the region’s overall hydrological cycle. These kinds of messages reinforce the priorities of all three groups: the need to maintain a high level of water quality, the need to reduce carbon emissions, and the need to act as stewards of the environment.
Resources
Case Study of North Texas Municipal Water District East Fork Wetland Project on North Texas Municipal Water District website.
Case Study of North Texas Municipal Water District East Fork Wetland Project on the John Bunker Sands Wetland Center website.
Sadie F. Dingfelder, From toilet to tap: Psychologists lend their expertise to overcoming the public's aversion to reclaimed water. (2004) APA Monitor. 35(8):26.
Lorie Woodward Cantu, John Bunker Sands Wetland Center, Texas Wildlife, August 2011: 46-50.
NEIGHBORHOOD/DEVELOPMENT SCALE: Central Texas Climate Change Environmental Public Health Indicators Project
This pilot project, located in Austin, Texas, demonstrates how public health participation in climate change and green building policies can reduce community vulnerability. The Central Texas Climate Change Environmental Public Health Indicators Project uses a GIS portal to provide the community and local policymakers with a source of visual analysis for how vulnerable populations and the environment could be impacted by proposed climate action policies. Its goal is to raise awareness among the general public about the links between climate change and public health.
Based on an historical evaluation of which natural hazards had resulted in the highest mortality rates in Travis County from 1970-2004, the project team developed two climate change indicators for the pilot phase: extreme heat events and flash flooding events.
This type of tool provides neighborhood-specific information about the environmental and health hazards associated with climate change. When a downscaled climate model is added, policymakers and planners could use the tool to perform a health impact assessment of future land use planning schemes (such as the comprehensive plan) – identifying which areas of town are likely to become more or less vulnerable to the effects of climate change over time.
It could also act as an educational tool for outreach to neighborhood associations, explaining the links between climate change and human health and the reasons a particular neighborhood has been identified as vulnerable to flooding. By providing background information and information about things the neighborhood could do to reduce their vulnerability, it could galvanize neighborhood associations to work together to reduce their vulnerability through activities such as: clearing out gullies, increasing low-impact stormwater strategies, and instituting a buddy program to check up on particularly vulnerable neighbors during flash flood events.
Resources
Borden, K. A., & Cutter, S. L. (2008). Spatial patterns of natural hazards mortality in the United States. International Journal of Health Geographics. 7(64). doi: 10.1186/1476-072X-7-64.
CIDRAP, ASTHO, Using Vulnerability Maps to Inform Local Public Health Policies and Climate Change Adaptation Efforts (TX).
GEMSS (Geospatial Emergency Management Support System), a project of TNRIS (Texas Natural Resources Information System).
Houghton, A.; Prudent, N.; Scott III, J. E.; Wade, R.; Luber, G. (2011). Climate change-related vulnerabilities and local environmental public health tracking through GEMSS: A web-based visualization tool. Applied Geography (in press). doi:10.1016/j.apgeog.2011.07.014.
SITE SCALE: On-Site Rainwater Capture, Treatment, and Reuse
The energy intensity associated with the municipal water system (from treatment to pumping), coupled with the increasing threat of being overwhelmed by natural disasters such as hurricanes and tornadoes, makes the concept of flipping our current water system from a centralized, uni-directional system to a distributed, multi-directional system more economically and politically feasible than in the past.
The concept of net zero water is similar to net zero energy: using a combination of water efficiency strategies and onsite water collection, treatment, storage, and reuse strategies to generate a development's water supply.
The 2011 Texas legislature passed two bills that expand the sources of potable water available to developments connected to the public water supply. HB 3391 allows developments to be designed to use harvested rainwater as their sole source of water supply. HB 3372 allows rainwater to be used as an indoor potable water source for structures connected to a public water system. Currently, no federal or state standards exist for harvested rainwater quality. These two bills therefore offer an ideal opportunity for local and state public health agencies to collaborate with TCEQ and the climate change community to develop reasonable guidelines for regulation that will safeguard the public's health without imposing requirements that are overly onerous -- either economically or technologically.
Resources
Texas HB 3391
Texas HB 3372
Texas A&M AgriLife Extension Website, Rainwater Harvesting Web Page.
Texas Water Development Board Website, Rainwater Harvesting Web Page.
Toward Net Zero Water: Best Management Practices for Decentralized Sourcing and Treatment. (2011) Cascadia Green Building Council.
Conclusion
The American culture has been so thoroughly convinced that modern sanitation practices protect them from the threat of waterborne diseases such as cholera, that the concept that they might once again rise to the level of major killers is largely rejected by mainstream society. However, climate change, population growth, land use parctices, and overconsumption have placed our centralized public water systems in peril. A new approach is needed to maintain access to high quality water in the future.
Each of the examples in this talk take an integrated approach to water management:
-
Identify and control the potential source of contamination (the primary goal of public health)
-
Reduce the carbon footprint associated with the water source (which will help communities meet their climate change objectives)
-
Design the human intervention to expand native habitat, enhance biodiversity, and restore the natural hydrological cycle (a fundamental goal of green building projects)
Examples such as these offer a model for the future of sustainable water management in the era of climate change.
Copyright: © Biositu, LLC, and Building Public Health, 2011.
Health Impact Assessments: A Design Tool?
 Health impact assessments (HIAs) have emerged over the past decade as a powerful tool to provide evidence-based recommendations to decision makers and community planning officials about the likely health co-benefits and co-harms associated with proposed policies and land use development proposals. While they are becoming a more common feature of community planning efforts, they can also bring value to specific building projects.
The benefits of conducting HIAs on specific building projects include:
-
Lengthening the project’s useful life;
-
Protecting the project’s property value by contributing to the long-term resilience of the surrounding community; and,
-
Prioritizing strategies that maximize both short-term efficiencies and long-term environmental, economic, and social value.
HIAs identify the most significant health impacts associated with a policy or project by following a six-step process, outlined by the U.S. Centers for Disease Control and Prevention:
1. Screening
2. Scoping
3. Assessing risks and benefits
4. Developing recommendations
5. Reporting
6. Evaluating
This process allows the project team to tailor design strategies to address the specific vulnerabilities and health concerns associated with a given population—whether the workers building the project, the building occupants, or the surrounding community.
While a successful HIA should prioritize data sets that are specific to the context of the project or policy under review, several existing green building resources offer a starting point for project teams interested in trying their hand at conducting an HIA:
-
Two literature reviews identify links between the community planning strategies outlined in LEED for Neighborhood Development and benefits to human health.
Understanding the Relationship Between Public Health and the Built Environment (2006)
-
Active Living Guidelines: Promoting Physical Activity and Health in Design reviews the evidence linking urban design, building design, sustainable design, and universal design with opportunities for physical activity and its associated health benefits.
-
The RIPPLE database links design, operational, cultural, and technology strategies, as well as industry standards with supporting evidence from the scientific literature and hospital case studies.
For more information on how HIAs can be tailored to specific building projects and how they can inform decisions related to climate change resilience, see Adele Houghton’s presentation at Gulf Coast Green 2011 and the companion article published in the Spring 2011 edition of the Journal of Green Building (Adele Houghton, Health Impact Assessments: A Tool for Designing Climate Change Resilience into Green Building and Planning Projects, Journal of Green Building, 6(2): 66-87).
Copyright: © Biositu, LLC, and Building Public Health, 2011.
