

Four Examples of Designs that Reduce the Site-Specific Health Risks of Climate Change. Example 4: Disease-Carrying Insects.

Disease-Carrying Insects
Health Impact
As annual temperatures warm and precipitation patterns change as a result of climate change, disease-carrying insects have begun to migrate into areas that may not be prepared for them. Dengue is the most common mosquito-borne virus in the world, resulting in 50 to 100 million infections and 25,000 deaths annually. However, the U.S. had largely escaped dengue outbreaks from the end of World War II to 1980. Since that time, sporadic outbreaks have occurred in the Southern U.S., particularly Texas and Florida. The average cost of treatment in the U.S. is $17,803 per patient. (Source: 3rd National Climate Assessment.)
Context
The primary carrier of the virus, the Aedes aegypti mosquito, is extremely sensitive to changes in temperature, precipitation, and the built environment. While models predict the spread of this mosquito north from Mexico and the Carribean into the contiguous United States, studies show that, historically, a combination of building design and social norms have largely protected Americans from infection when outbreaks occur South of the international border. A study of a Dengue outbreak in 1999 found that the level of dengue present in the population of Laredo, Texas, was 1/2 - 1/10 of the population in Nuevo Laredo, Tamaulipas (just across the border in Mexico). The findings were most closely correlated with the presence of closed windows and air conditioning in Texas buildings, effectively blocking exposure to mosquitoes. Furthermore, buildings on the Mexican side of the border not only lacked central air conditioning but their interiors were also often left open to the elements without protective screens over windows and doors.
Design Strategy
As operable windows, passive cooling, and natural ventilation become more common features of green buildings, care must be taken to protect occupants from health threats that could enter from the outside. Otherwise, as has been noted in a number of multi-family developments already, building occupants are not likely to make use of these energy efficiency features – both to avoid the annoyance of stinging insects and to protect themselves from diseases like dengue.
Relevant LEED v4 Credit(s)
Benefits to Climate Change Mitigation and Adaptation
In this example, the homes and businesses in Mexico were more energy efficient than buildings in the U.S., because they did not use air conditioning. This is an example where energy efficiency (i.e., climate change mitigation) should be balanced with safeguards such as screens that protect building occupants from the health hazards associated with climate change (i.e., climate change adaptation).
Go Back to Drought/Flood Example.
Go Back to Main Post.
Copyright: © Biositu, LLC, and Building Public Health, 2015.
Four Examples of Designs that Reduce the Site-Specific Health Risks of Climate Change. Example 3: Drought/Flood Cycle.

Drought/Flood Cycle
Health Impact
The drought/flood cycle has already shifted in many parts of the U.S. due to climate change. Heavy precipitation events are becoming more common each year, concentrating annual rainfall into a smaller period of time each spring, and washing water downstream that historically would have replenished lakes, rivers, and aquifers. Less precipitation falls throughout the remainder of the year, leading to drought conditions. Drowning is the most direct health effect of flooding, resulting in 98 deaths per year in the U.S. It is of particular concern in areas prone to flash flooding and/or tropical storms. Other health impacts associated with drought and flooding include waterborne illness caused by compromised water quality and respiratory illness due to damp indoor environments (flooding) or exposure to wildfires or dust storms (drought). (Source: 3rd National Climate Assessment.)
Context
Central Texas is known as “Flash Flood Alley,” due to the rapidity and severity of flooding that occurs there, particularly following major droughts. In 2008, I co-authored a vulnerability map of Austin, TX, that identifies the neighborhoods with them most acute combination of social vulnerability (e.g., population density, elderly, socially isolated, and minority populations) and environmental vulnerability (e.g., flood plains and low water crossings).
Design Strategy
In subsequent research, I found that evidence in the public health literature supported applying a number of credits in the U.S. Green Building Council’s Leadership in Energy and Environmental Design (LEED) rating system as protective measures in vulnerable neighborhoods. These green building strategies include:
-
promoting the use of alternative forms of transportation to provide multiple evacuation options during flooding events;
-
increasing native vegetation on-site to maximize stormwater retention and filtration; and,
-
making use of rainwater to irrigate, flush toilets, and even provide potable water during and immediately following flooding events.
Relevant LEED v4 Credit(s)
Site assessment
Sensitive land protection
Access to quality transit
Reduced parking footprint
Site development – protect or restore habitat
Open space
Rainwater management
Heat island reduction
Outdoor water use reduction
Indoor water use reduction
Benefits to Climate Change Mitigation
Site shading can reduce a building’s electricity use, one of the major causes of anthropogenic (i.e., human caused) greenhouse gas (GHG) emissions. Alternative forms of transportation reduce the other major source of GHG emissions associated with the built environment – single occupancy car travel.
Benefits to Climate Change Adaptation
Reduce exposure of vulnerable populations to flash flooding. Mitigate exposure through multiple evacuation routes and access to potable water if occupants choose to shelter in place during a flood.
Go Back to Extreme Heat Example. Continue to Disease-Carrying Insects Example.
Go Back to Main Post.
Copyright: © Biositu, LLC, and Building Public Health, 2015.
Four Examples of Designs that Reduce the Site-Specific Health Risks of Climate Change. Example 2: Extreme Heat.

Extreme Heat
Health Impact
The number and intensity of heat waves is increasing in the U.S., resulting in spikes in mortality from heat-related conditions such as heat stroke. Heat waves can also increase the death rate among people with cardiovascular, respiratory, or cerebrovascular disease. (Source: 3rd National Climate Assessment.)
Context
According to the MN Department of Health, in 2001, in spite of an average summer temperature of only 63.8o F, 19 people died in Minnesota of heat-related illness (mostly in the months of July and August). Since that time, as a member of the U.S. CDC’s Climate-Ready States and Cities Initiative grant program, the state has worked on improving prevention and emergency response activities related to extreme heat.
Design Strategy
An HIA facilitated by Biositu, LLC compared the relative vulnerability to heat among three affordable housing designs located in adjacent neighborhoods along the new Central Corridor light rail line between Saint Paul and Minneapolis.
In spite of the projects’ close proximity to each other and similar scope, the recommendations resulting from the HIA varied widely.
-
Recommendations for a mixed-income, mixed-use development in the Hamline-Midway neighborhood: Include a pocket park as part of the development design to mitigate the urban heat island effect. Provide water fountains, misting stations, and interactive water features for children. Install ceiling fans and operable windows with screens to encourage natural ventilation while protecting residents from mosquitoes and other pests. Install an on-site renewable energy installation to provide an uninterruptable power supply in certain common areas in case a heat wave results in a prolonged power outage.
-
Recommendations for a single-family house retrofit in the Frogtown neighborhood: Install landscaping that prioritizes shading the house, deterring mosquitoes, and cultivating edible plants. Focus energy efficiency measures on the roof and attic to reduce solar heat gain during summer months. (Example strategies: light colored or vegetative roof, increased attic insulation, etc.) Install combination storm shutters/screens on doors and windows to encourage use of natural ventilation. Vent the basement to protect for radon contamination and fit it out for use as an in-house cooling center during extreme heat events.
-
Recommendations for a mixed-use, affordable housing development in the Summit-University neighborhood: Install ceiling fans and operable windows with screens to encourage natural ventilation while protecting residents from mosquitoes and other pests. Fit out common areas with air conditioning and designate them as public cooling centers during heat events.
Relevant LEED v4 Credit(s)
Site assessment
Site development - protect or restore habitat
Open space
Heat island reduction
Optimize energy performance
Renewable energy production
Benefits to Climate Change Mitigation
Shading and energy efficiency measures reduce a building’s electricity use, one of the major causes of anthropogenic (i.e., human caused) greenhouse gas emissions.
Benefits to Climate Change Adaptation
Reduce exposure of vulnerable populations (i.e., children and minorities) to extreme heat events. Mitigate exposure through misting stations, water fountains, and cooling centers.
Go Back to Air Pollution Example. Continue to Drought/Flood Example.
Go Back to Main Post.
Photo Credit: Nevit Dilmen
Copyright: © Biositu, LLC, and Building Public Health, 2015.
Four Examples of Designs that Reduce the Site-Specific Health Risks of Climate Change. Example 1: Air Pollution.

Air Pollution
Health Impact
Climate change is projected to increase ground level ozone and/or particulate matter, which can exacerbate respiratory conditions like asthma. (Source: 3rd National Climate Assessment.)
Context
The site selected for the Jack London Gateway Senior Housing project in West Oakland, CA, suffers from poor outdoor air quality due to its proximity to several freeways and the Port of Oakland. Elderly are more vulnerable to the negative health effects of air pollution than the general population. A Health Impact Assessment (HIA) performed by Human Impact Partners recommended identifying sources of air pollution by measuring current levels of particulate matter at several locations on the site and researching the Port’s plans for expansion.
Design Strategy
The entrance of the 55-unit complex was located inside a courtyard oriented away from the freeways and Port and towards the existing neighborhood. Balconies facing the freeway were converted into bay windows. And, air filters were installed in all residential units and common spaces.
Relevant LEED v4 Credit(s)
Site assessment
Minimum indoor air quality performance
Enhanced indoor air quality strategies
Benefits to Climate Change Mitigation
Integrating the complex into the existing neighborhood encourages alternative forms of transportation, which reduces single vehicle car use.
Benefits to Climate Change Adaptation
Reduce exposure of a vulnerable population (the elderly) to air pollution.
Continue to Extreme Heat Example.
Go Back to Main Post.
Copyright: © Biositu, LLC, and Building Public Health, 2015.
Four Examples of Designs that Reduce the Site-Specific Health Risks of Climate Change

The health effects of climate change have been in the news this summer.
Over the course of three weeks:
-
Pope Francis released the first-ever encyclical letter calling for immediate and sustained action to mitigate climate change and protect the most vulnerable from exposure to climatic events.
-
The prestigious Lancet Commission on Health and Climate Change released its 2015 report, which couches climate change as the most significant community health opportunity of our generation.
-
And, the White House hosted a summit, which resulted in the release of eight actions to protect communities from the health effects of climate change.
Green building design can help protect occupants from the negative health effects of climate change. However, the level of risk shifts from location to location in response to changes in the environmental, demographic, and community health context.
Click on the links below to read about four examples of the role design can play in protecting building occupants from the contextual health risks of climate change.
Note: The health impact statements in each example have been paraphrased from the Human Health section in the 3rd National Climate Assessment.
Are you interested in learning about how this type of assessment can benefit your design project or existing facility? Contact us at This email address is being protected from spambots. You need JavaScript enabled to view it. for additional information about our services and a free initial consultation.
Copyright: © Biositu, LLC, and Building Public Health, 2015.
Infrastructure Strategy: Mixed-Use Suburban Neighborhood Development, Eastern Temperate Forest Ecoregion
Visit the Overview blog post for an introduction to the Building Public Health Blog Library of Strategies.
Visit the Reference section below for the primary source of data incorporated into this blog post.
Context
The context for this proposed design strategy is a mixed-use suburban neighborhood development outside a north-central Connecticut town with roughly 30,000 residents and a median household income close to the 2009 national average of $50,221. The town’s dense, historic center is surrounded by low-density suburban residential neighborhoods that are serviced by shopping centers and big box retail stores located on major thoroughfares. A commercial and light industrial corridor was developed along 3-5 miles of a major roadway in the 1980’s. These businesses employ some local residents; however, many of their employees drive in from other suburbs, and many of the town residents commute to other towns and suburbs to work.
How Resilient Is The Surrounding Infrastructure?
Roads & Transit
-
Multiple transportation routes are available to and from the area, including the major North/South freeway that cuts through the state (Interstate 91), the Northeast Regional Amtrak rail with a nearby stop, CT Transit regional bus lines, and the planned New Haven/Hartford/Springfield commuter rail project.
-
Furthermore, bike lanes and trails, while incomplete, are readily available and increasingly developed in the area.
-
A regional airport is also located nearby.
Benefits & Risks – The site’s context is typical of many suburban areas in the U.S. in that it is extremely well connected to roads, but the transportation scale prioritizes cars over other forms of transportation. The level of density both in the site’s region and between the site and major employment hubs, however, merits the use of commuter rail and bike paths to a larger extent than suburbs in less densely populated regions.
Water Source and Distribution
-
Source – The development falls within the jurisdiction of The Metropolitan District (MDC), a non-profit municipal corporation established in 1929 that supplies potable water, wastewater, and stormwater services for Hartford and seven surrounding municipalities. The raw water is sourced from surface water in Connecticut and Massachusetts, most of which flows from watersheds that are owned and protected by the MDC into two large reservoirs about 20 miles from the site.
-
Quality – The MDC treats the water introduced into the potable water system using sand filtration, chlorination, fluoridation, pH adjustment, and corrosion control. An on-site laboratory tests for physical, chemical, and bacteriological contaminants in three locations: the reservoirs, the treatment plants, and designated sampling sites throughout the service area. The 2010 Water Quality Report indicates overall high water quality; however, three of 52 sites tested for lead were found to be above the maximum allowable concentration level of 15 ppb. Back flow prevention (i.e., cross-connection control devices) are required on sites using alternative water sources (such as rainwater collection) and for process water uses, such as irrigation, solar hot water systems, and geothermal wells.
-
Quantity – The MDC website and 2010 Water Quality Report offer water efficiency tips and encourage water conservation generally. However, other than a reported increase in residential irrigation, which may strain water supplies in the future, the services area appears not to suffer at the present from water scarcity.
Benefits & Risks – >The public water system provides access to high quality water; however, two-thirds of its water is treated using a system built in 1929. Furthermore, the distribution and sewer infrastructure was developed in the 1850’s. The system therefore suffers from the vulnerability common to all centralized utilities. The regulations designed to prevent cross-contamination to the public water supply may discourage or not allow installation of certain on-site water collection, treatment, and storage systems, further increasing the region’s vulnerability to loss or widespread contamination of its water supply if the historic water treatment facility is compromised.
Wastewater
-
The public wastewater collection system is also managed by MDC. A main treatment facility and three satellite facilities provide both primary and secondary treatment of effluent from sewers in the service area. All sludge is processed in the main facility in Hartford. Three of these facilities were awarded Gold Peak Performance Awards by the National Association of Clean Water Agencies to recognize 100% compliance with their national pollutant discharge elimination system permit in 2010.
-
The public water and wastewater system was initially developed in the 1850’s and suffers from both combined sewer overflows (CSOs) and sanitary sewer overflows (SSOs). The MDC has launched a program called The Clean Water Project with the goals of reducing the number of CSOs, eliminating SSOs, and reducing the levels of nitrogen entering water bodies by 2020. According to the MDC, the sewer separation project will coincide with other infrastructure upgrades such as utility upgrades and street resurfacing.
Benefits & Risks – The public wastewater system provides a high level of wastewater treatment at a low level of individual effort; however, according to the MDC, CSOs and SSOs lead to more than 50 instances a year of untreated sewage entering the Connecticut River. Also, as part of the region’s centralized water/wastewater system, it is vulnerable to the same concerns raised above in the Water section.
Electricity
-
Connecticut has deregulated its electrical power sector. It is therefore possible for property owners to choose which power company to contract with, including companies that offer renewable energy options. The CT Clean Energy Options Program assists consumers in supporting renewable power by purchasing it through their electric service provider. The Connecticut Clean Energy Fund has established a Clean Energy Communities program that rewards communities that have increased the percentage of renewable power purchased both by the municipal government and by utility customers.
-
The state of Connecticut has instituted a number of policies and programs to incentivize distributed renewable power installations and electric vehicles. For example, the Clean Energy Incentives Program and the Connecticut Energy Efficiency Fund offer rebates and other incentives to residential and commercial/institutional projects that install solar PVs, solar thermal systems, geothermal and heat pump systems, and even small wind generation systems. The Electric Vehicles (EV) Infrastructure Council is charged with overseeing the development of an infrastructure to support EVs and incentivizing their purchase by residents. The Customer-Side Distributed Generation Program offers low interest loans to electric generation and/or conservation projects ≥ 50 kW. It also awards valuable renewable energy credits to applicable generation projects.
Benefits & Risks – Currently, most of the state of Connecticut relies on the centralized electric grid for all of their electric power. However, the state is actively incentivizing the installation of distributed energy generation, particularly from renewable sources. The size of a typical mixed-use suburban neighborhood development would increase the array of electric generation options open to it, some of which could be specific to a building site while others might service the entire development.
Climate Change Impacts
The Adaptation Subcommittee to the Governor of Connecticut’s Steering Committee on Climate Change used downscaled climate models developed by the New York Panel on Climate Change to identify the following climatic changes in the 21st century:
-
Temperature – Annual average temperatures in Connecticut are projected to rise from 4-7.5 °F. The frequency, duration, and intensity of heat waves may also increase, while extreme cold events may reduce in frequency.
-
Precipitation – The total amount of precipitation may increase by 5-10%; however, it is projected to fall more often in the form of severe rain events, causing flooding.On the other end of the spectrum, droughts are also expected to increase in frequency, duration, and intensity.
-
Sea Level Rise – Sea levels are projected to rise by 12-23 inches, causing the coastal areas to be more vulnerable to flooding threats associated with extreme storm events. Under the “Rapid Ice-Melt Sea Level Rise” scenario, the sea level may increase by 41-55 inches.
Based on these projections, the subcommittee predicted that the following types of infrastructure will be negatively impacted by climate change:
-
Coastal flood control and protection
-
Dams and levees
-
Stormwater infrastructure
-
Transportation infrastructure (including airports, water ports, railroads, and roadways)
-
Facilities and buildings (including telecommunication, electric generation, interstate gas pipelines, and solid waste management, in addition to vital buildings such as hospitals and fire stations)
Imagine You Were Designing a Mixed-Use Suburban Neighborhood Development in this Community…
Based on the information listed above regarding the current condition of the community and regional infrastructure and its likely future as the climate continues to change, you might consider starting the design process by asking questions such as:
-
Why do the majority of employees along the commercial corridor adjacent to the site choose to commute 30 minutes to work everyday? What amenities are available in their neighborhoods that are not present in the neighborhood surrounding the site? How might you entice them to live closer to work?
-
What are the gaps in the current transportation network that prevent the employees in adjacent businesses from using a combination of public transit and active transportation (i.e., walking and cycling) to commute to and from work? What are the transportation barriers for area residents?
-
How vulnerable is the site to disruption in water supply, electricity, telecommunications, solid waste pick up, and other utilities during an extreme weather event? Are there opportunities to reduce or offset this vulnerability by providing some of these services on-site?
-
Which on-site utilities (such as water collection, energy generation, composting, etc.) should be considered for the entire neighborhood development? Which should be encouraged for specific building projects?
-
What incentives and variances are available through state and local funding sources to help offset the cost of installing energy- and water-efficiency measures, on-site renewable energy generation, etc.?
-
Could the project register as a pilot program for new and innovative technologies that are being developed by companies headquartered in Connecticut? How might this type of program enhance the project's appeal to area landowners, businesses, and future tenants/homeowners?
The answer to these questions might result in solutions similar to the following list of design recommendations, which have been organized to highlight their relevance to building codes, green building programs, and greenhouse gas emissions reduction programs.
|
Design Recommendations |
Relevance to… |
|
|
|
|
Building/Planning Codes |
Green Building Programs |
GHG Emissions Programs |
|
1. Provide a range of housing types (multi-family, single family attached, single family detached); sizes (studio, 1-bedroom, multiple bedrooms); and, costs. Focus on the housing types favored by employees of nearby businesses who currently commute long distances to work. |
Building code may require certain densities, number of parking spaces, etc., that limit the variety of housing options in the area. |
LEED for Neighborhood Development encourages this approach. |
Enticing employees of nearby businesses to live close to work can help the township achieve status as a CT Clean Energy Community. |
|
2. Design the development to fill in transportation gaps wherever possible. For example, install bike paths and sidewalks. Work with the regional bus system to connect the site to the commuter rail station, the historic downtown area, and regional shopping centers. |
This strategy may help support a request for a variance to reduce the minimum number of parking spots required for the development. |
Alternative transportation. |
Reduces emissions by reducing the number of trips made in single-occupancy vehicles. |
|
3. Design the site landscaping to retain, filter, and reuse stormwater on-site to reduce erosion, the risk of flooding, and compromising river water quality. |
Coordinate with the MDC’s Clean Water Project. (add link) |
Erosion control. Stormwater mitigation. Water efficient landscaping. |
Reduces emissions by reducing the volume of water processed by the wastewater treatment plant. |
|
4. Maximize the efficiency of water fixtures and eliminate potable water use for landscape irrigation. |
Rebates and incentives may be available to help finance some new technologies. |
Water use reduction. Water efficient landscaping. |
Reduces emissions by reducing demand on the public water system. |
|
5. Pilot test distributed wastewater technologies to reduce demand on the central wastewater system. |
Codes will govern the level of treatment required and the type of usage allowed. Coordinate with the MDC’s Clean Water Project. (add link) |
Wastewater use reduction. |
Reduces emissions by reducing demand on the public wastewater system. |
|
6. Investigate options for on-site rainwater collection, filtering, storage, and reuse. |
Codes will govern the level of treatment required and the type of usage allowed. Health and safety codes may not allow rainwater inside buildings. |
Erosion control. Stormwater mitigation. Water efficient landscaping. Water use reduction. |
Reduces emissions by reducing demand for potable water and reducing the volume of water processed by the wastewater treatment plant. |
|
7. Work with the local public health agency to test the filtration level of onsite water collection and wastewater treatment so that the development is authorized to use it as drinking water. |
Codes will govern the level of treatment required and the type of usage allowed. |
Stormwater mitigation. Water efficient landscaping. Water use reduction. Wastewater use reduction. |
Reduces emissions by reducing demand for potable water and reducing the volume of water processed by the wastewater treatment plant. |
|
8. Investigate options for on-site renewable energy sources. |
Incentives may be available to help fund on-site renewable energy installations and pilot projects. |
On-site renewable energy. |
Reduces emissions by replacing demand for conventional electricity sources with emissions-free energy. |
|
9. Investigate options for an on-site composting program and community garden. |
Codes will govern composting activities. |
Waste reduction. Water efficient landscaping. Water use reduction. |
Reduces emissions by reducing food miles traveled and the energy associated with transporting solid waste. |
|
10. Require all residential buildings in the development to be designed as net-zero energy homes and all commercial buildings to be designed to support passive survivability during an extreme weather event. |
Incentives may be available to help fund energy efficiency, water efficiency, and on-site renewable energy strategies. |
Energy optimization. Water use reduction. On-site renewable energy. |
Reduces emissions by reducing demand on the central energy and water systems and by replacing demand for conventional electricity sources with emissions-free energy. |
References
Adaptation Subcommittee to the Governor’s Steering Committee on Climate Change (April 2010), The Impacts of Climate Change on Connecticut Agriculture, Infrastructure, Natural Resources and Public Health (link)
Connecticut Clean Energy Fund (link)
Connecticut Clean Energy Incentives Program (link)
Connecticut Customer-Side Distributed Generation Program (link)
Connecticut Energy Efficiency Fund (link)
Connecticut Electric Vehicles (EV) Infrastructure Council (link)
CT Clean Energy Options Program, available at: (link)
CT Transit (link)
The Metropolitan District (MDC) (link)
New Haven/Hartford/Springfield commuter rail project (link)
U.S. Census (link)
U.S. EPA Level I Ecoregions (link)
Are you interested in learning about how this type of assessment can benefit your design project or existing facility? Contact us at This email address is being protected from spambots. You need JavaScript enabled to view it. for additional information about our services and a free initial consultation.
Copyright: © Biositu, LLC, and Building Public Health, 2011.
Overview: Library of Strategies
Designing and operating facilities that enhance community resilience requires researching the specific health, economic, and environmental conditions of a project's surroundings. Specifically, projects should use the following questions to help guide the decisionmaking process:
-
How resilient is the surrounding infrastructure?
-
How resilient is the building structure?
-
How resilient are the building occupants?
-
How resilient is the surrounding community?
The "Strategy" series of blog postings is designed to compile a library of strategies to help green building design, construction, and operations professionals, as well as owners, developers, policymakers, regulators, and community planners prioritize strategies that maximize a project's long-term co-benefits to human health, economic health, and climate change adaptation and mitigation.
In order to meet this objective, each strategy is tailored to the specific context of a hypothetical or case study building site. While the highlighted project may be hypothetical, the data used to develop the strategy recommendations is real. For additional information, visit the Reference section in each individual strategy.
Copyright: © Biositu, LLC, and Building Public Health, 2011.
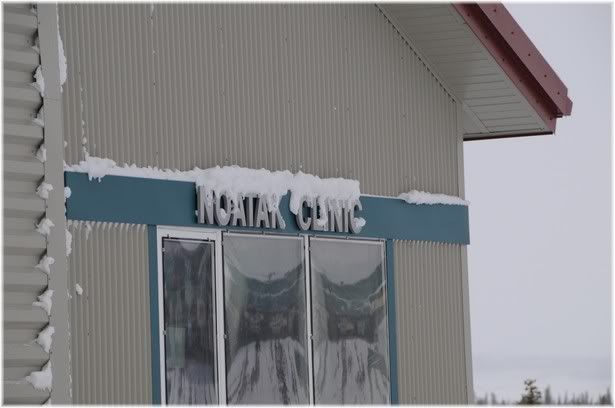
Infrastructure Strategy: Rural Health Clinic, Tundra/Taiga Ecoregion
Photo Credit: Aqvaluq Photography
Visit the Overview blog post for an introduction to the Building Public Health Blog Library of Strategies.
Visit the Reference section below for the primary source of data incorporated into this blog post.
Context
The context for this proposed design strategy is a remote community in Northeast Alaska with a population of roughly 500 residents from the Inupiat tribe. The economy relies mainly on subsistence activities (i.e., hunting, gathering, and fishing). The modern community was founded in 1939 as part of the Indian Reorganization Act; however, residents relocate to temporary camps closer to the coast during the summer months.
How Resilient Is The Surrounding Infrastructure?
Roads & Transit
-
Transportation routes to and from the community rely on water: ice in the winter and river navigation in the summer. Both routes are being disrupted via shorter sea and river ice in the winter and low water levels in the summer.
-
Barge service is not possible due to low water levels.
-
Airplane cargo transport is expensive.
Benefits & Risks – The relative remoteness of the village enables residents to pursue a subsistence economy with minimal encroachment from other economic activities. However, dependence on a seasonal transportation infrastructure risks an increasing number of disruptions as the climate warms, possibly leading to rising prices and shortages in fuel, food, and other supplies.
Permafrost
-
Critical infrastructure has become vulnerable to subsidence and erosion as the permafrost melts unevenly.
Benefits & Risks – Construction techniques can attempt to minimize the likelihood of further permafrost melt; however, they cannot reverse the overall trend.
Water Source and Distribution
-
Source – The community sources water from three shallow wells located in the Noatak River. Low water levels have led to occasional seasonal water shortages.
-
Quality – Water quality has been compromised in two ways: through increased turbidity in the river caused by erosion from heavy precipitation events and through the introduction of landfill waste in the river caused by bank erosion. Increasing levels of giardia lamblia and cryptosporidium have been detected at the water treatment plant, increasing water filtration costs to an unsustainable level. Traditional water sources also can be contaminated with pathogens such as giardia lamblia.
-
Quantity – The community water treatment plant was constructed in 1995 with storage designed to service a population of 486 for 3 days; however, the population connected to the water supply currently exceeds 500. Roughly 70% of homes are connected to the public water system. The rest continue to haul water and use honey buckets to treat waste.
-
Structural Integrity – The community water treatment plant was constructed with a reinforced concrete slab foundation on an insulated gravel pad and ten thermosyphons that remove heat from the ground to prevent the permafrost from thawing. In spite of these measures, the permafrost has thawed to a depth of 5-10 feet, compromising the foundation. Contributing factors: warm pipelines, drifting snow, rainwater runoff, solar heat gain. Breaks in the water main have averaged >1 per year over the past decade and are increasing. Breakages are attributed to thawing permafrost and appear to coincide with increasing air temperature.
Benefits & Risks – The public water system provides access to high quality water; however, the treatment plant is over capacity, is extremely energy-intensive, and suffers from increasing vulnerability to structural failures due to melting permafrost.
Wastewater
-
The public wastewater collection system was constructed in 1992 to service the sites connected to the public domestic water system and includes a 7,500 linear foot sewer main, arctic pipe cleanouts, and a system of manholes.
-
Septic tanks perform primary treatment, and the resulting effluent is discharged to a 50,000-gallon lagoon before flowing down into a 3-acre tundra pond for secondary treatment. Waste sludge is deposited in the community landfill.
-
Similar to the potable water system, the public wastewater system suffers from sagging sewer pipes and settling manholes.
Benefits & Risks – The public wastewater system provides a higher level of wastewater treatment at a lower level of individual effort than the traditional honey bucket system; however, similar to the potable water system, it is extremely energy-intensive, and suffers from increasing vulnerability to structural failures due to melting permafrost.
Stormwater Mitigation
-
Thawing permafrost and increased severity of precipitation events are causing flooding damage to fragile riverbanks and coastlines.
Benefits & Risks – Risks associated with increased stormwater include injury, compromised water quality, risk of mold growth in flooded structures, and reduced subsistence food supplies.
Imagine You Were Designing a Replacement Health Clinic in this Community…
Based on the information listed above regarding the current condition of the community water infrastructure and its likely future as the climate continues to change, you might consider starting the design process by asking questions such as:
-
Considering its structural problems and capacity constraints, should we connect to the central water & wastewater system at all?
-
What alternatives exist for water collection, treatment, and storage?
-
How can we conserve water?
-
What type of water efficient fixtures function in this area? Can we obtain them?
-
Can we treat and store water on-site to multiple levels of purity based on the use it will be put to?
-
What is the best way to design a foundation that may sit on permafrost today but will likely need to transition to a floating foundation in a few years?
-
How will that transition affect the water and sewer pipes? Do they need to be located above ground instead of below ground?
-
What can we learn from the way water is conveyed, treated, and disposed at the community’s seasonal subsistence camps that will help the permanent community become more resilient to climatic changes?
The answer to these questions might result in solutions similar to the following list of design recommendations, which have been organized to highlight their relevance to building codes, green building programs, and greenhouse gas emissions reduction programs.
|
Design Recommendations |
Relevance to… |
|
|
|
|
Building/Planning Codes |
Green Building Programs |
GHG Emissions Programs |
|
1. Design the site landscaping to retain, filter, and reuse stormwater on-site to reduce erosion, the risk of flooding, and compromising river water quality. |
Codes will govern the level of treatment required and the type of usage allowed. |
Erosion control. Stormwater mitigation. Water efficient landscaping. |
Reduces emissions by reducing the volume of water processed by the wastewater treatment plant.
|
|
2. Maximize the efficiency of water fixtures. Investigate whether a hybrid technology between traditional flush toilets and honey buckets might be implemented successfully on-site. |
Health and plumbing codes guidelines may restrict efficiency technologies in certain areas of the clinic.
|
Water use reduction. |
Reduces emissions by reducing demand on the public water system. |
|
3. Design underground water pipes with flexible connections to minimize the likelihood of breakages in the event of uneven settlement due to melting permafrost. |
Building codes in regions with floating foundations may provide guidance on best practice technologies.
|
Increasing longevity of building structures and water infrastructure. |
Reduces emissions by reducing waste in the public water system caused by leaks. |
|
4. Install foundation monitors and built-in leveling devices to facilitate conversion to a floating system when the permafrost melts. |
Building codes in regions with floating foundations may provide guidance on best practice technologies.
|
Increasing longevity of building structures and water infrastructure. |
Reduces emissions by reducing the need to retrofit and/or rebuild foundations and infrastructure. |
|
5. Pilot test distributed wastewater technologies to reduce demand on the central wastewater system. |
Codes will govern the level of treatment required and the type of usage allowed.
|
Wastewater use reduction. |
Reduces emissions by reducing demand on the public wastewater system. |
|
6. Investigate options for on-site rainwater and snow storage, including whether the health clinic should manage its water supply and wastewater autonomously or whether an on-site water and wastewater system might service the surrounding neighborhood. |
Codes will govern the level of treatment required and the type of usage allowed. |
Erosion control. Stormwater mitigation. Water efficient landscaping. Water use reduction. |
Reduces emissions by reducing demand for potable water and reducing the volume of water processed by the wastewater treatment plant.
|
|
7. Work with the local public health agency to test the filtration level of onsite water collection and wastewater treatment so that the development is authorized to use it as drinking water. |
Codes will govern the level of treatment required and the type of usage allowed. |
Stormwater mitigation. Water efficient landscaping. Water use reduction. Wastewater use reduction. |
Reduces emissions by reducing demand for potable water and reducing the volume of water processed by the wastewater treatment plant.
|
|
8. Investigate options for on-site renewable energy sources that could power an on-site water and/or wastewater system. |
Incentives may be available to help fund on-site renewable energy installations. |
On-site renewable energy. Stormwater mitigation. Water efficient landscaping. Water use reduction. |
Reduces emissions by reducing energy demand, reducing potable water demand, and reducing the volume of water processed by the wastewater treatment plant. |
Reference
Climate Change in Noatak, Alaska: Strategies for Community Health. (2011) Alaska Native Tribal Health Consortium Center for Climate and Health. Available at: http://www.anthc.org/chs/ces/climate/upload/Climate_Change_in_Noatak_Strategies_for_Community_Health.pdf
U.S. EPA Level I Ecoregion Website. Available at: http://www.epa.gov/wed/pages/ecoregions/na_eco.htm
Image Credit: (C) Aqvaluq Photography.
Image available at: http://i149.photobucket.com/albums/s63/tundratantrum/noataktrip8.jpg
Tundratantrum blog, Keeping it Real at 66 Degrees North Latitude.
Are you interested in learning about how this type of assessment can benefit your design project or existing facility? Contact us at This email address is being protected from spambots. You need JavaScript enabled to view it. for additional information about our services and a free initial consultation.
Copyright: © Biositu, LLC, and Building Public Health, 2011.
